Shared:Group 3
GROUP 3
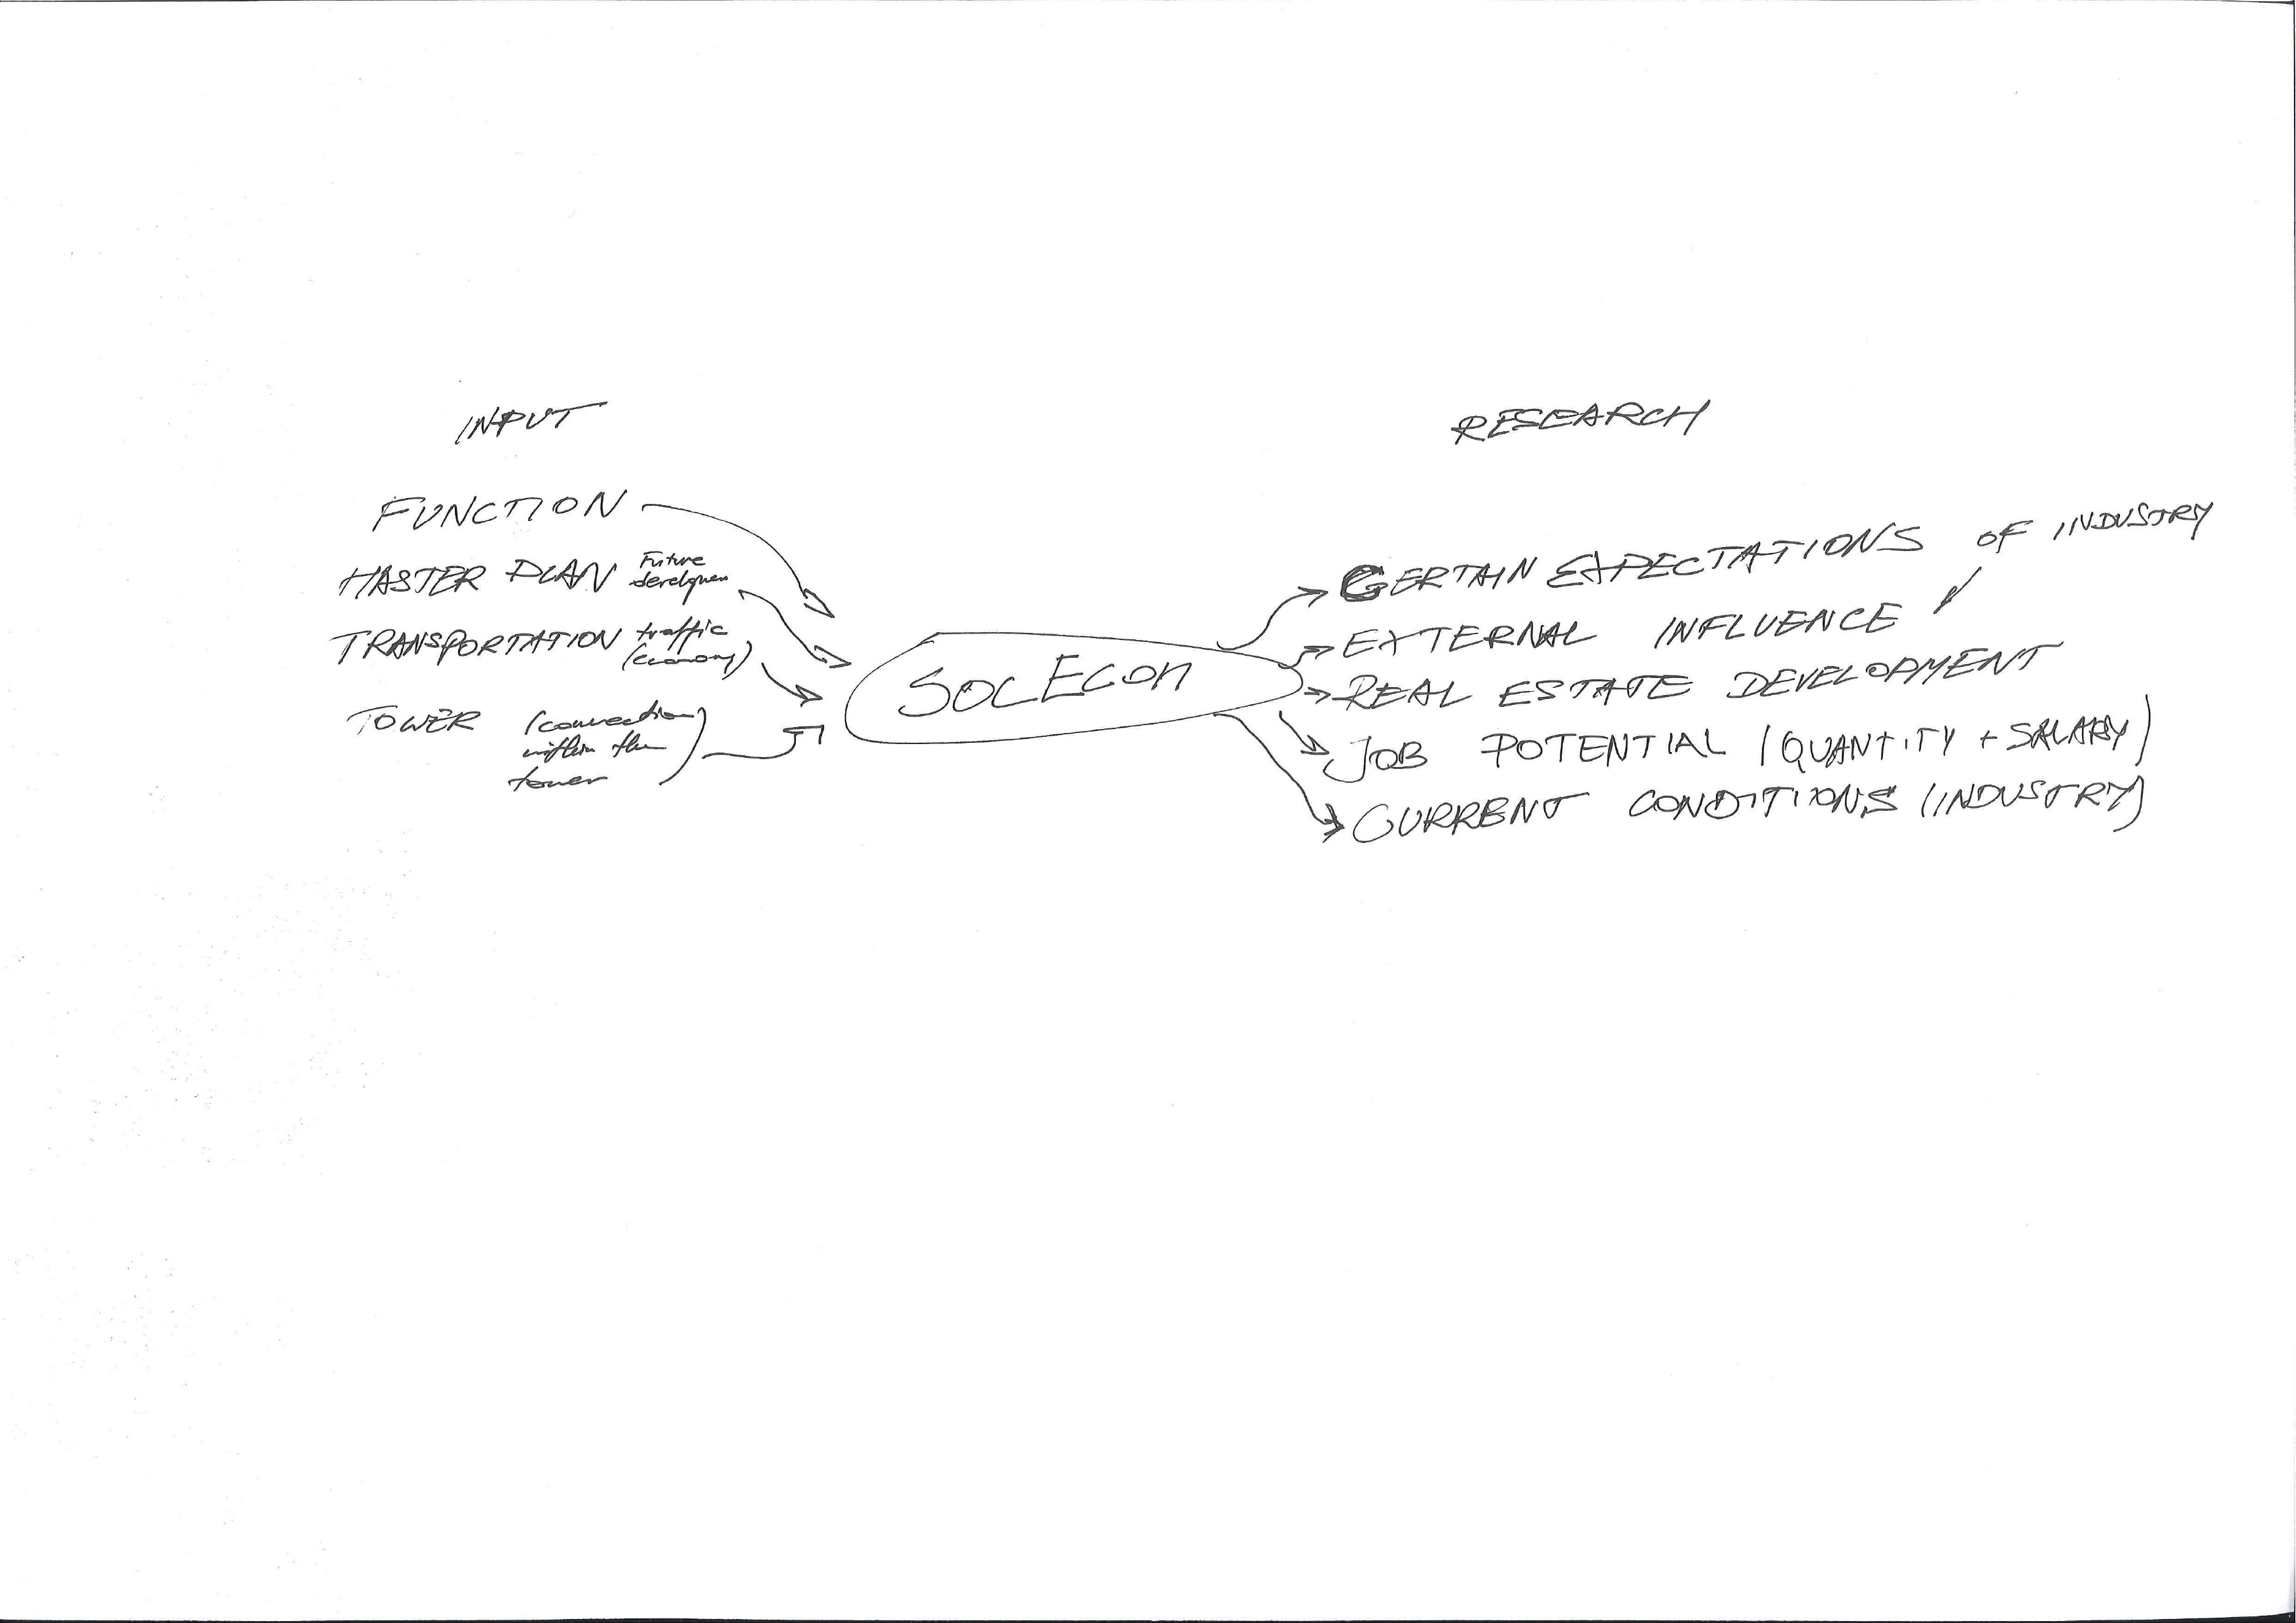
SOCIO ECONOMIC ANALYSIS
SocioEconomicAnalysis 10_09
SocioEconomicAnalysis 09_19
List of Products
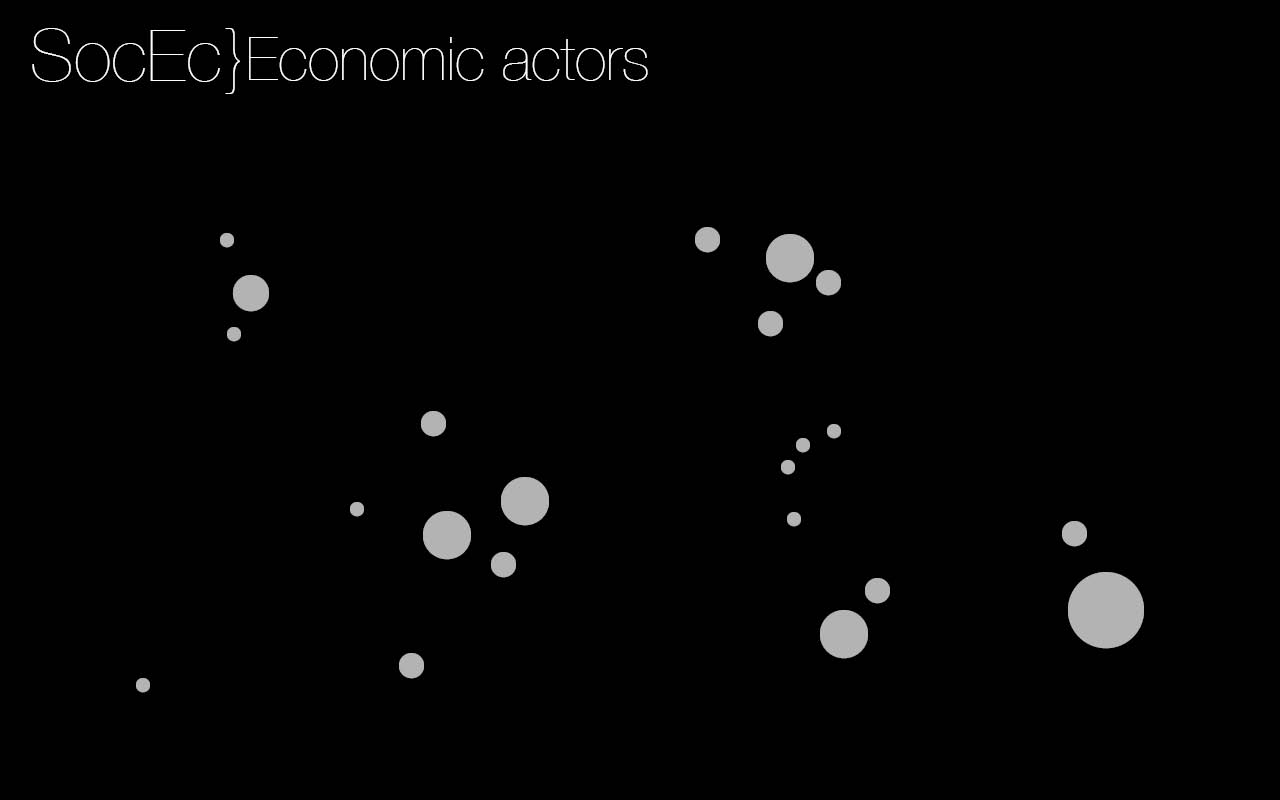
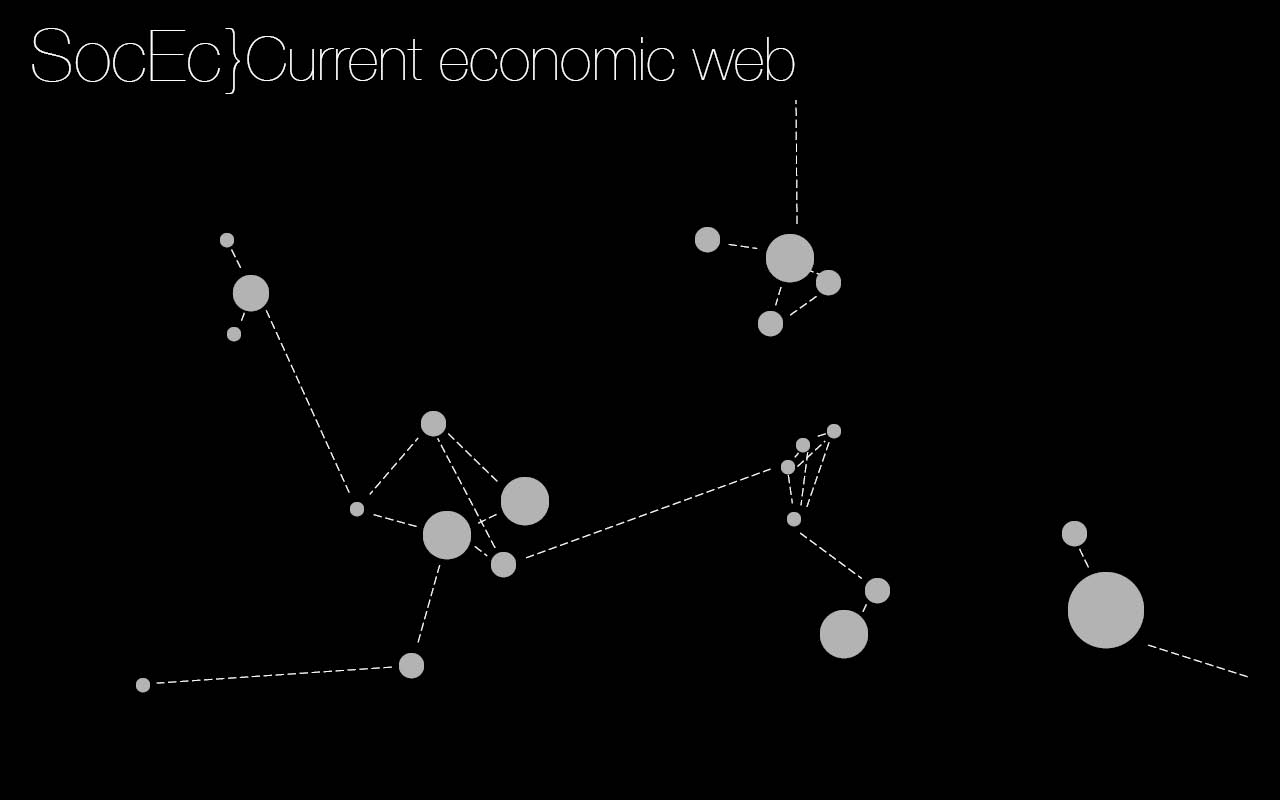
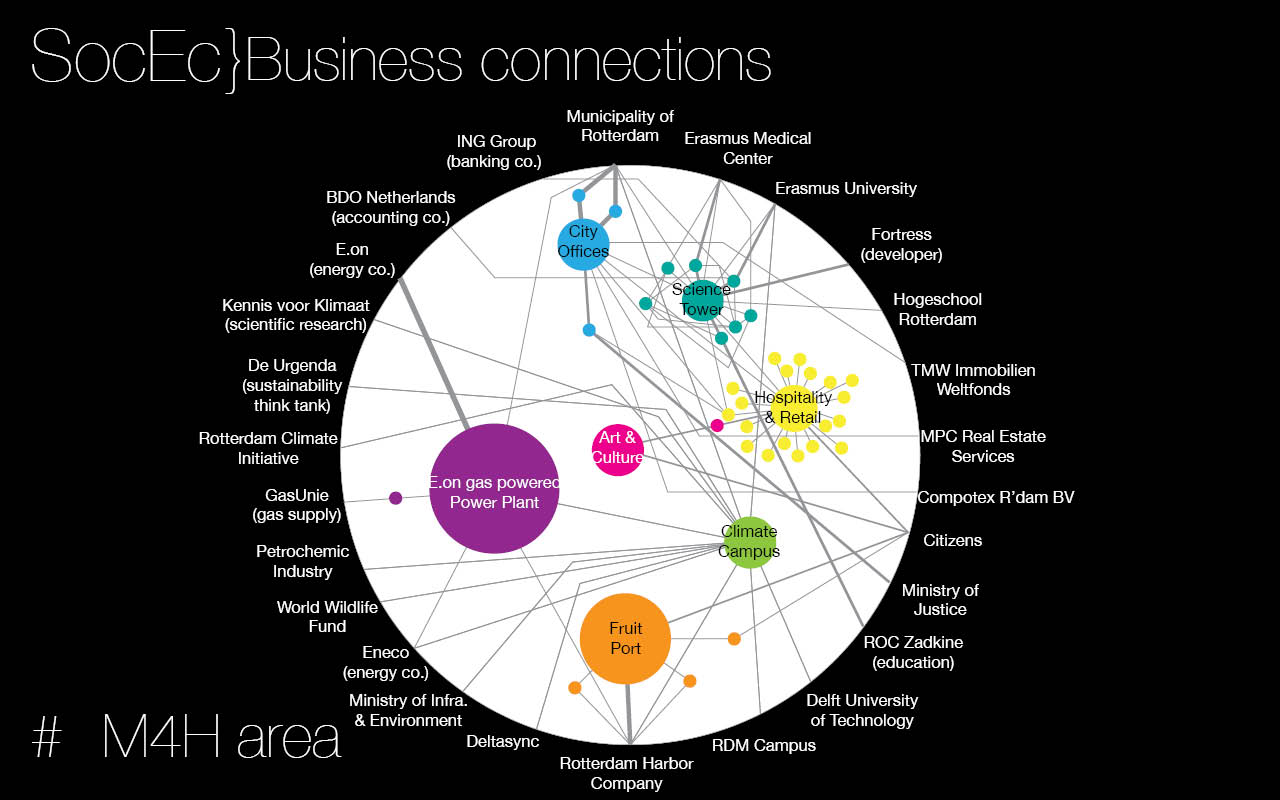
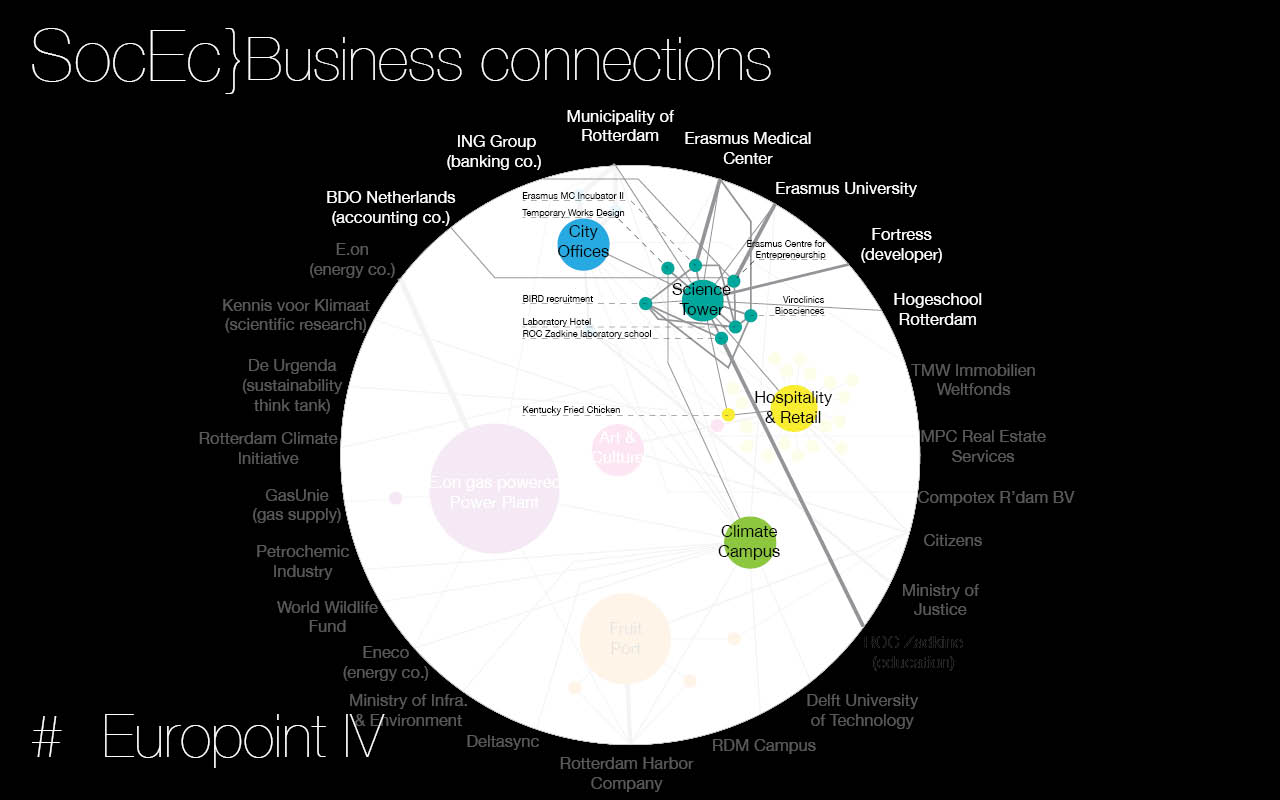
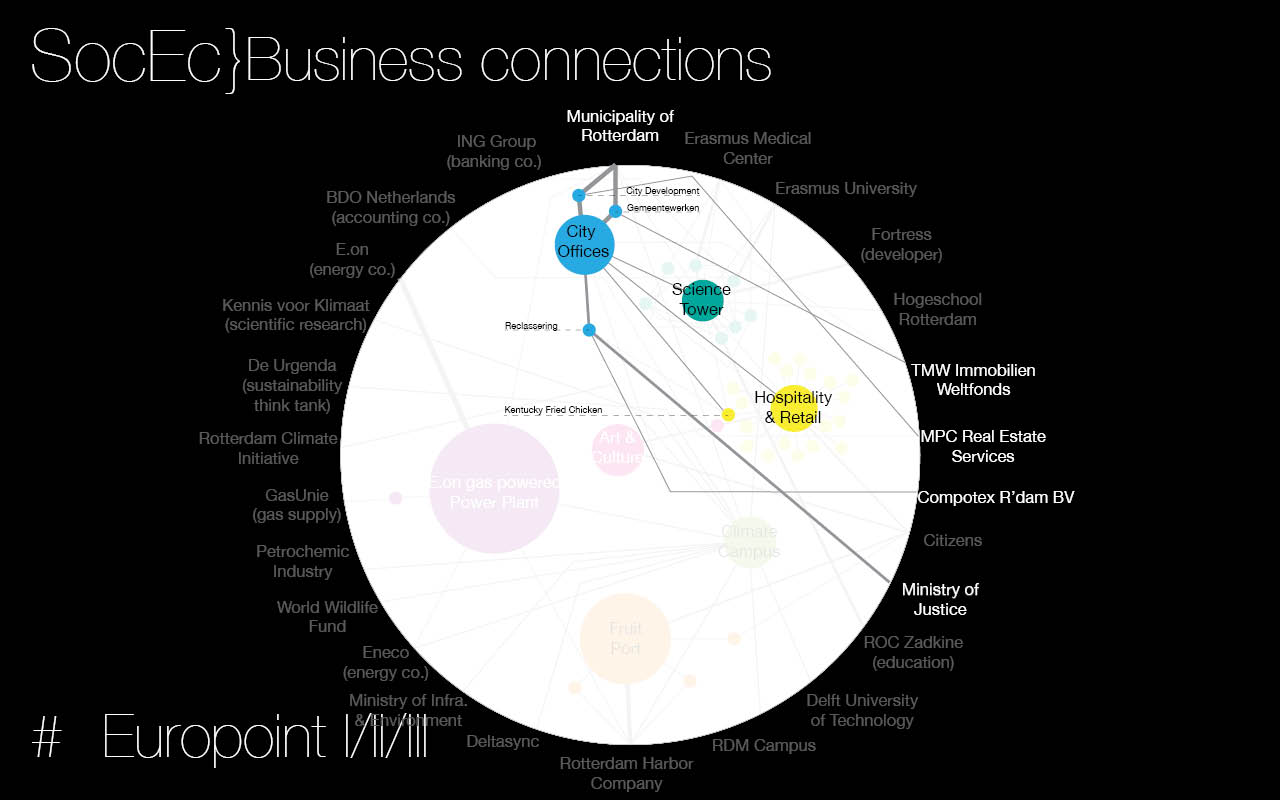
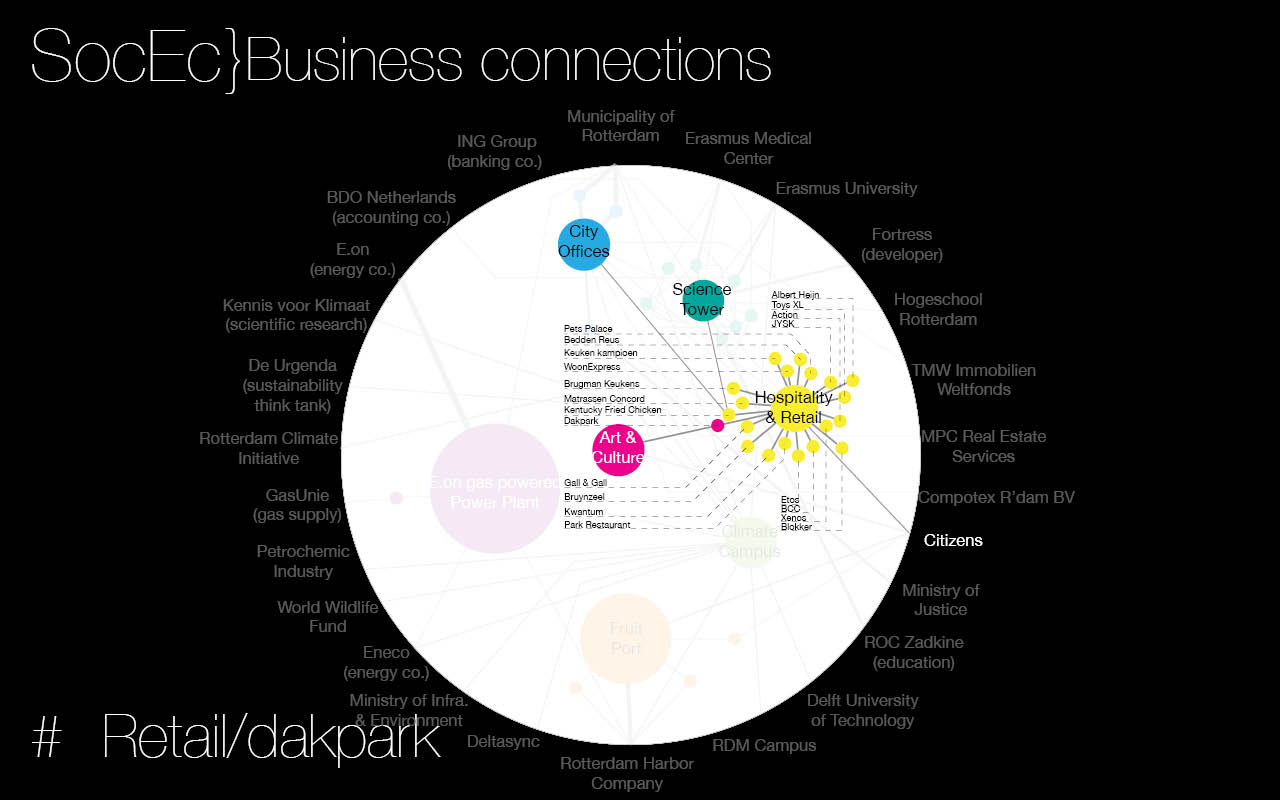
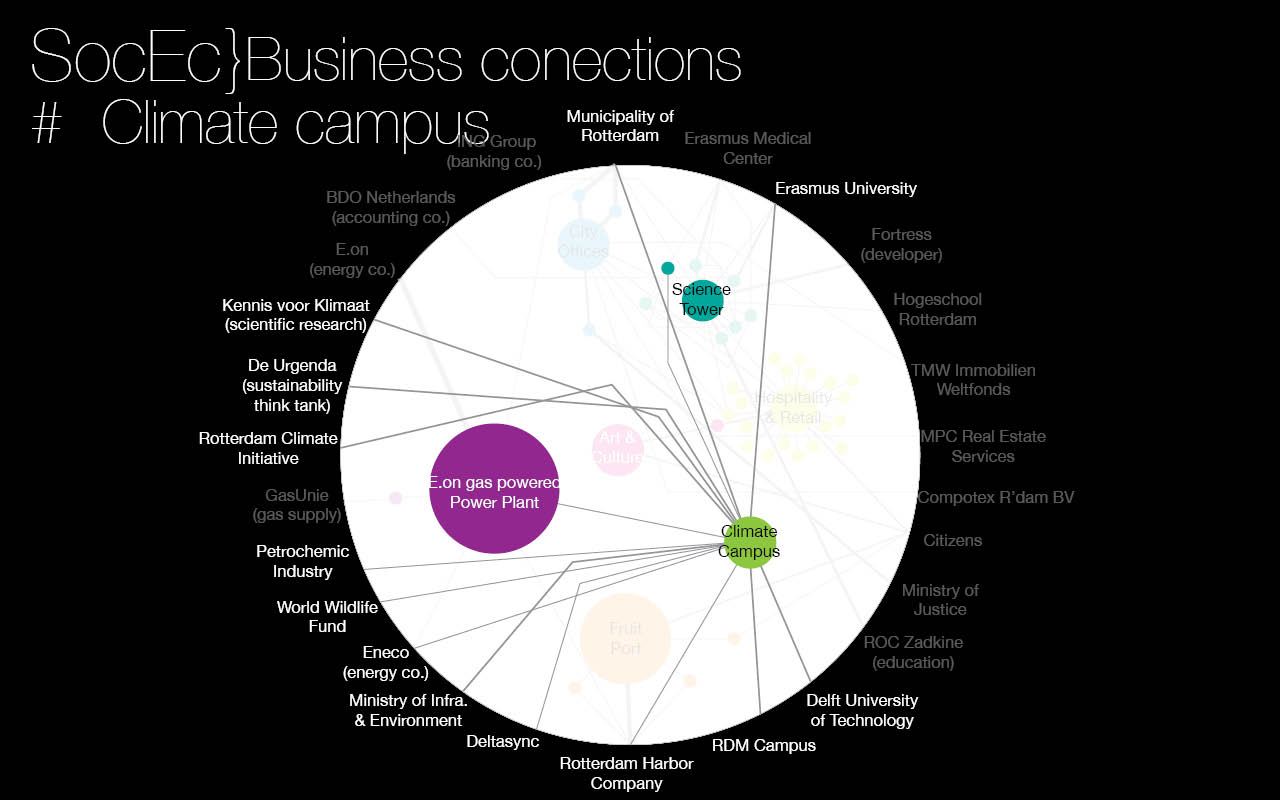
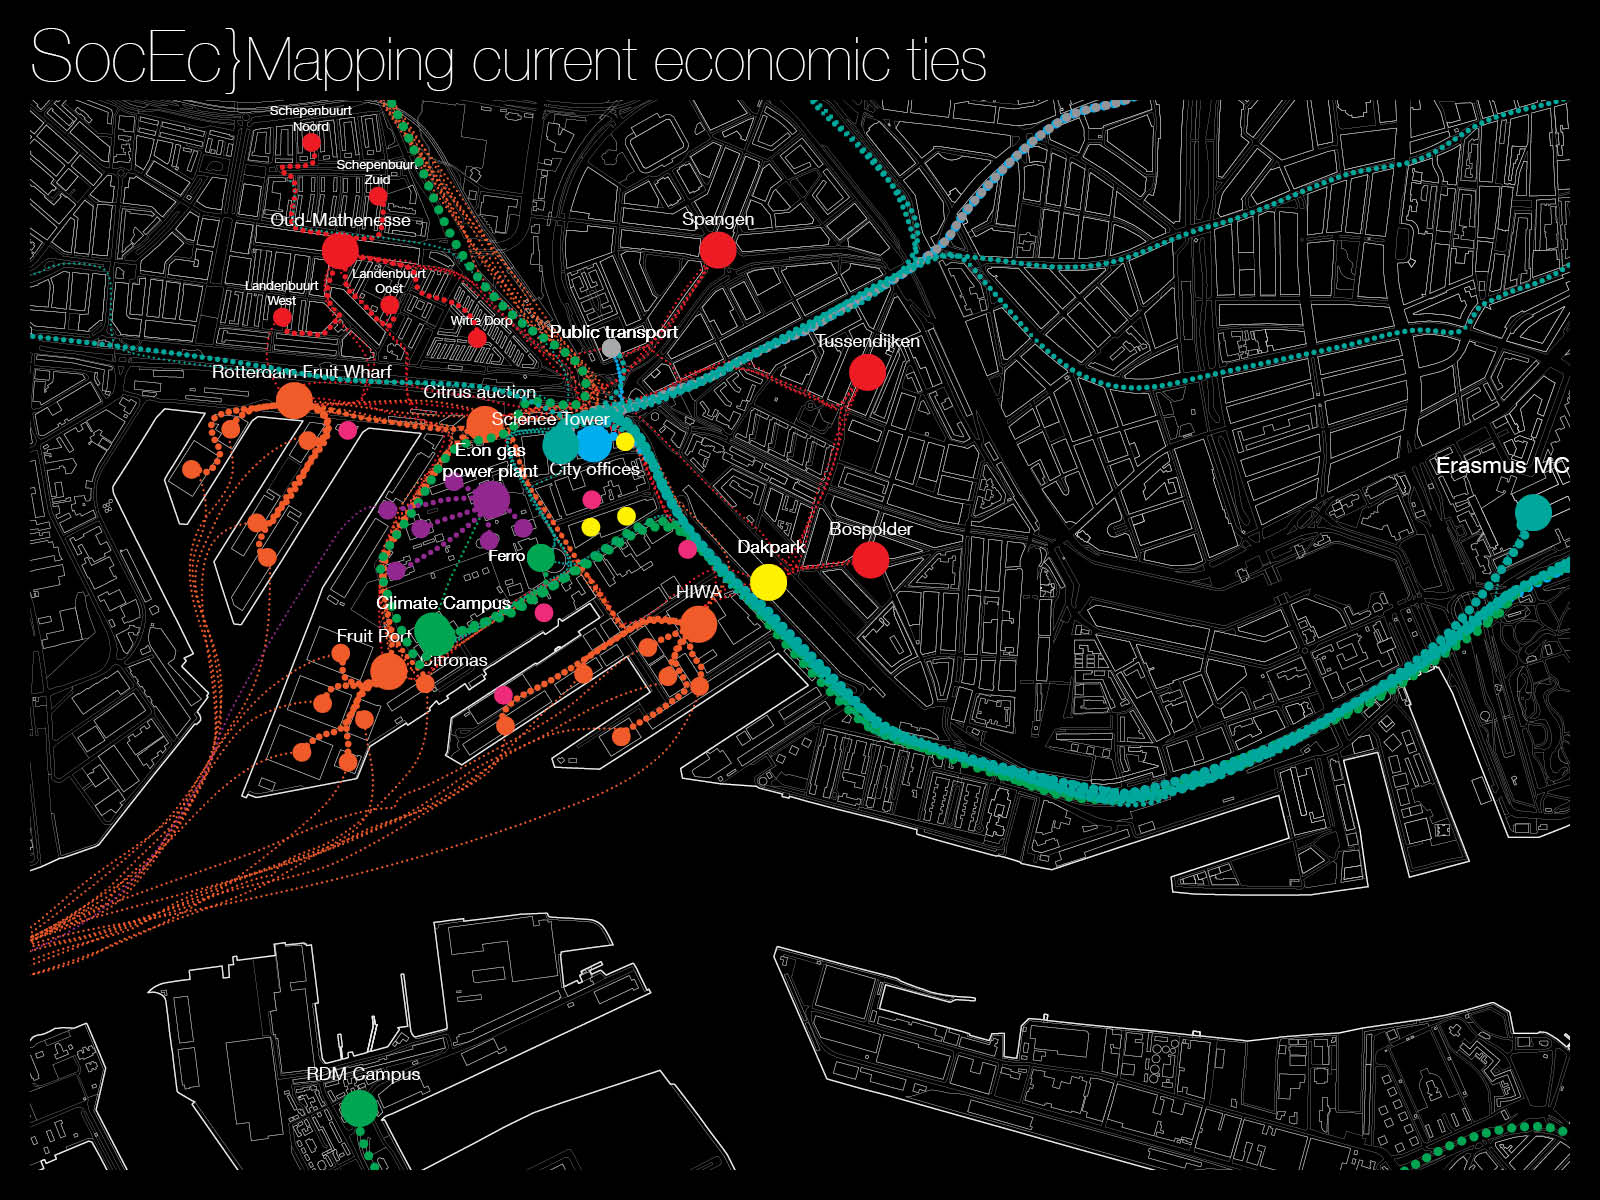
1] A web of relations between the economic actors
A. Will give us suggestions of which are the gaps that need to be filled in to enhance the creation of value/growth.
B. Will give us insight in the relation between economic activity and social behaviour
Some questions:
Where does the money go?
Where do goods go?
Who are the clients of businesses?
Who are the suppliers?
How does the local economy compare to the city economy?
Diagrams to be prepared:
Types of companies in the area - Network
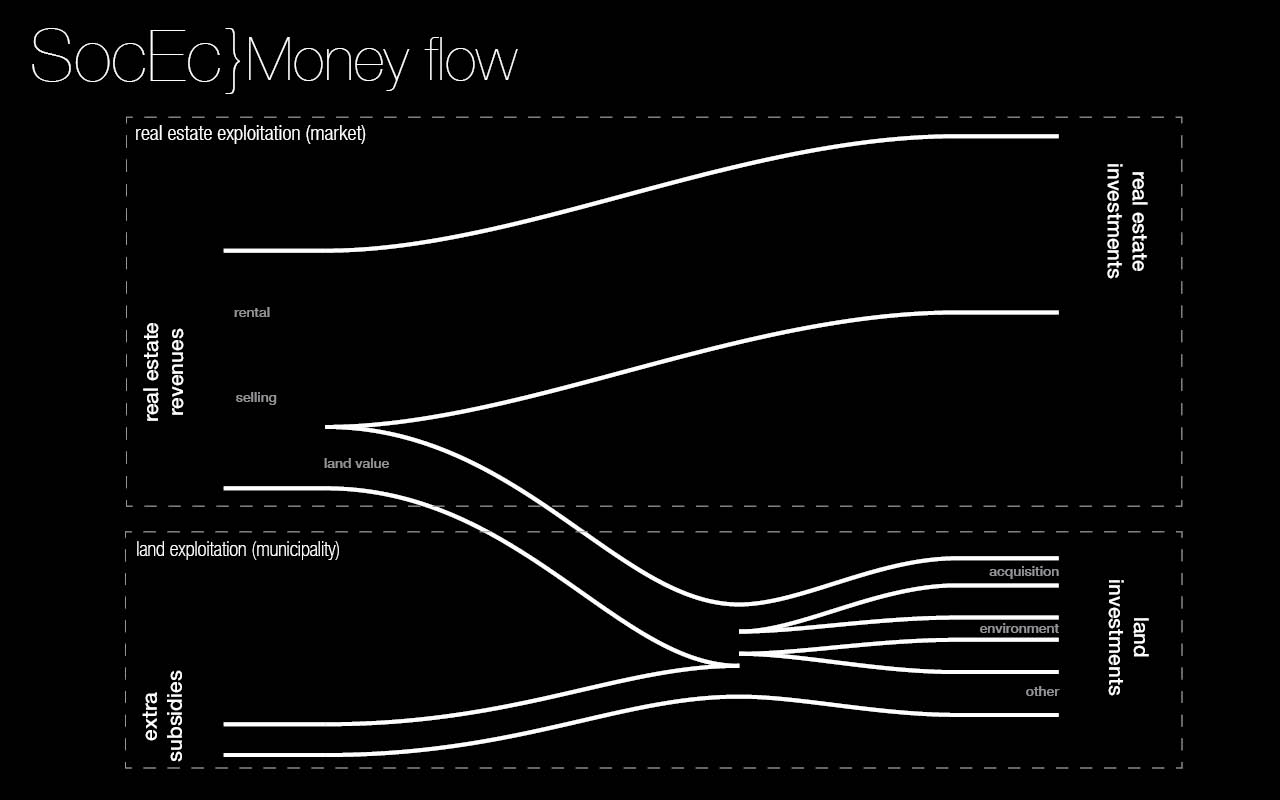
Flow of money between companies + Income of them - Potential for investment
Time of reimbursement of costs incurred - compare to new strategies for building (digital fabrication)
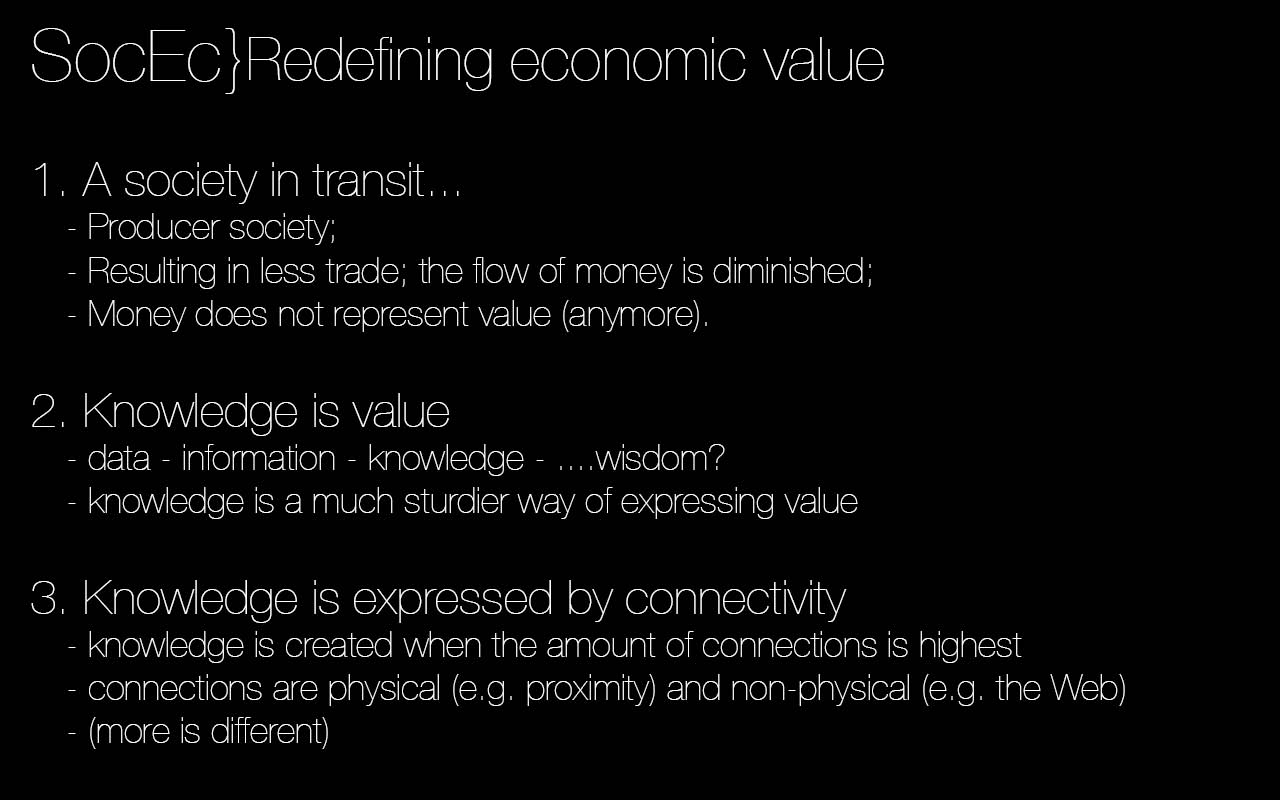
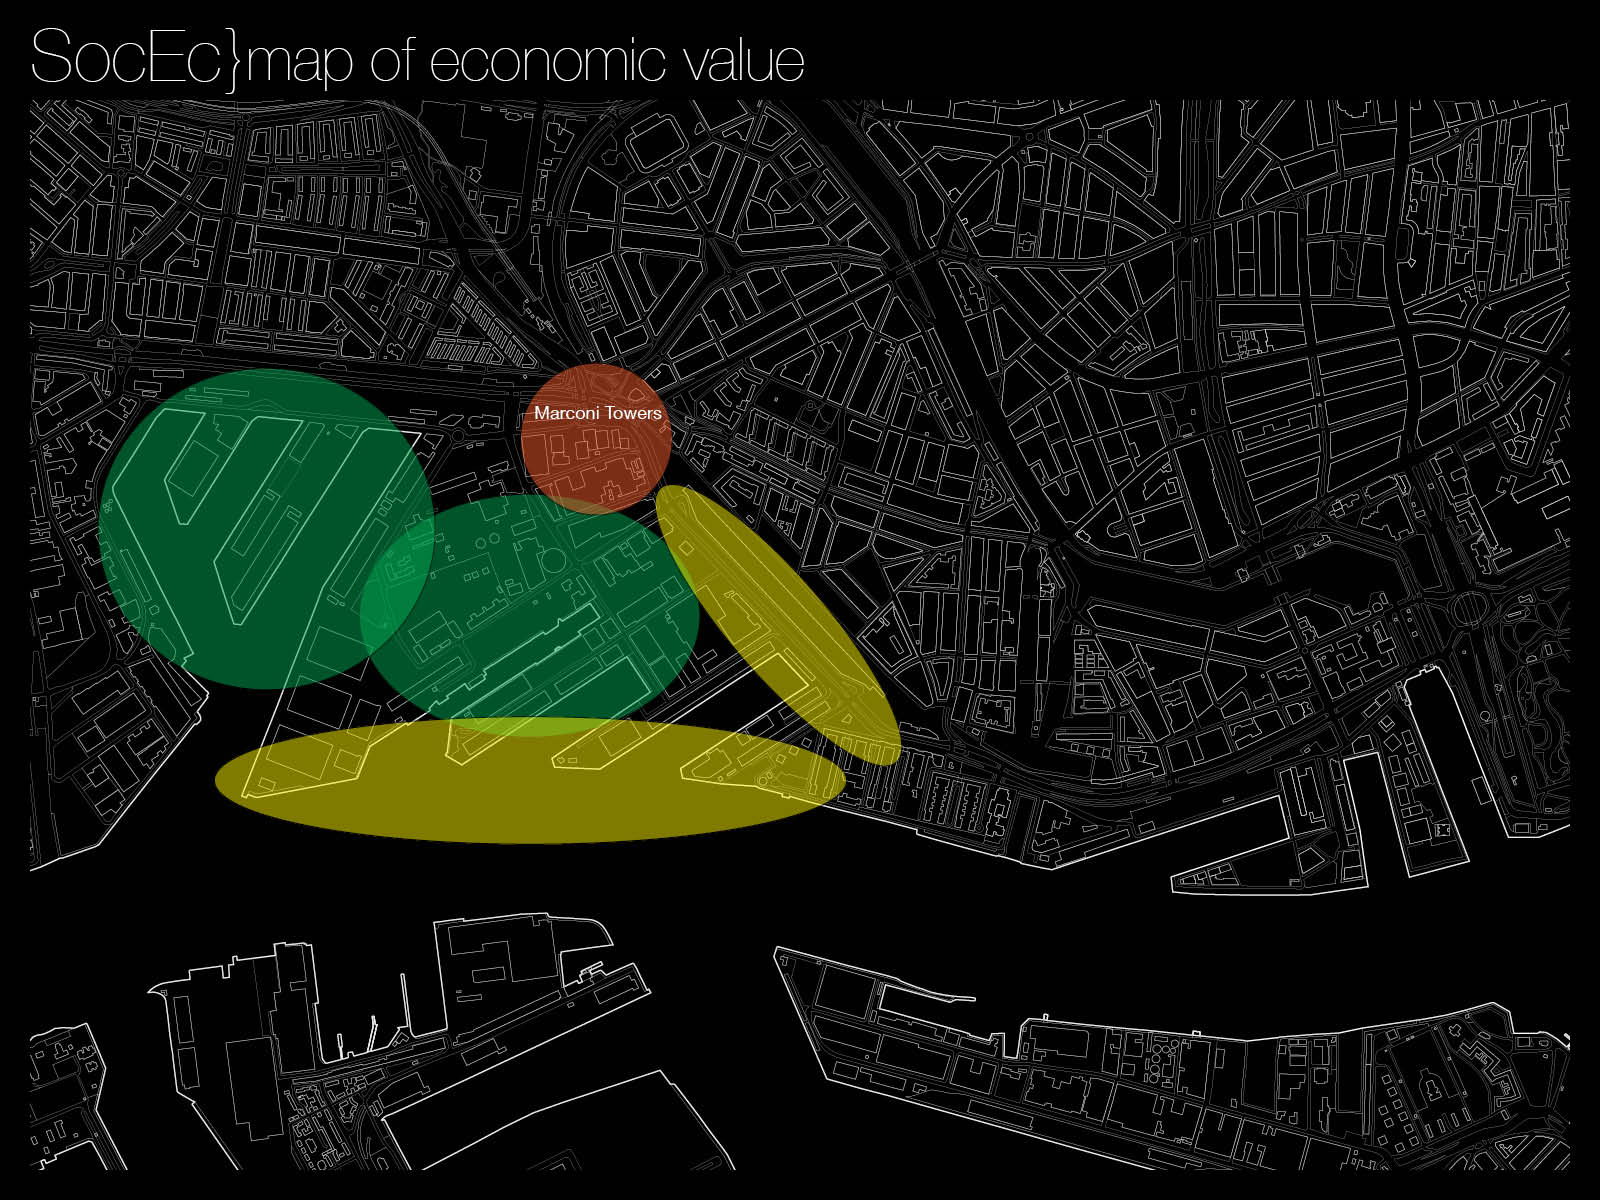
2] Economic values
A. Will give us insight in the kind of investment is reasonable
Value of the people involved in the economic system. Income, purchasing power
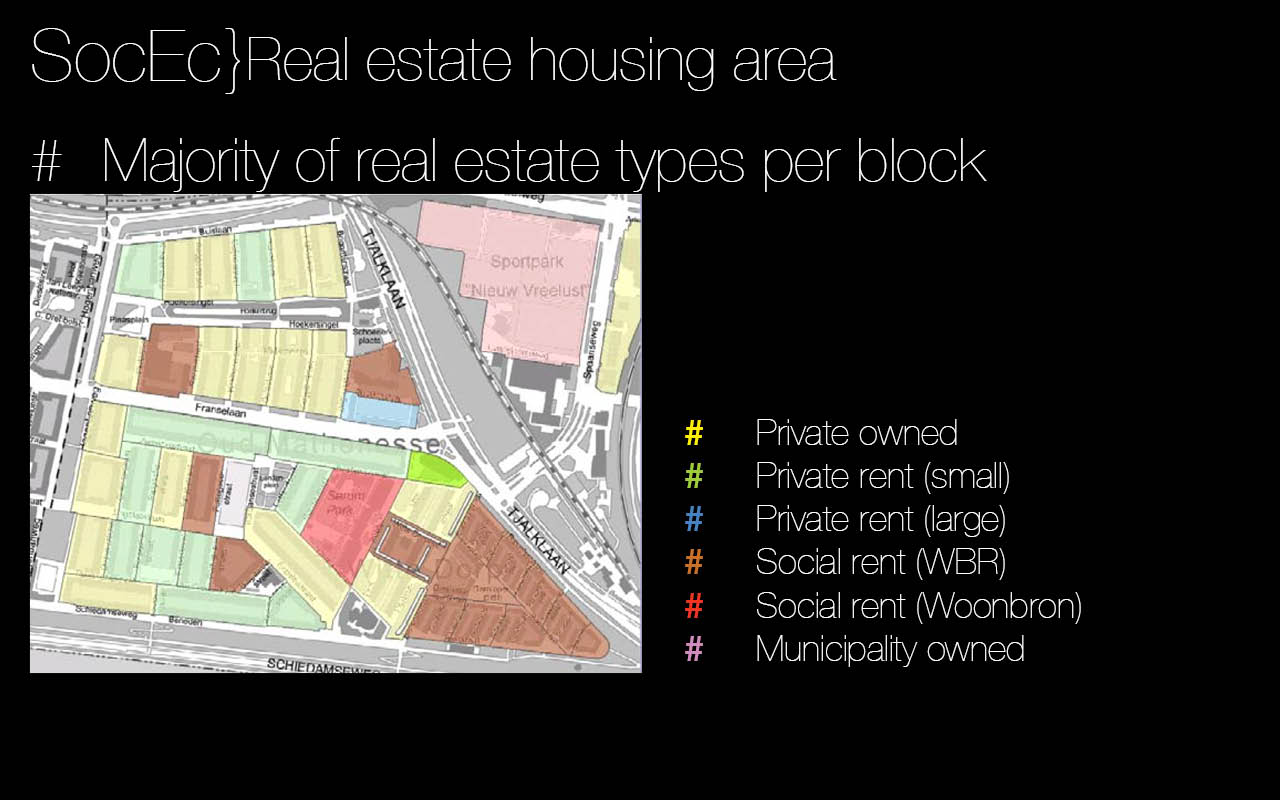
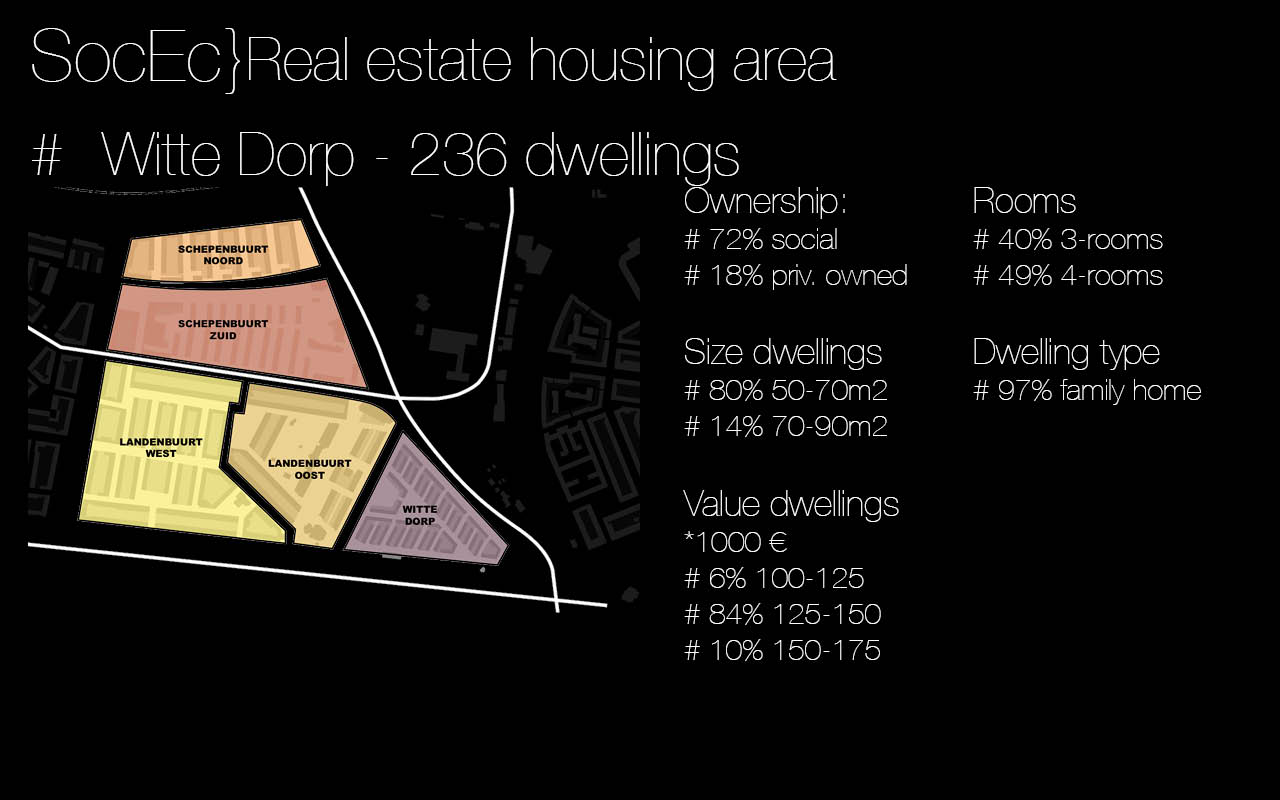
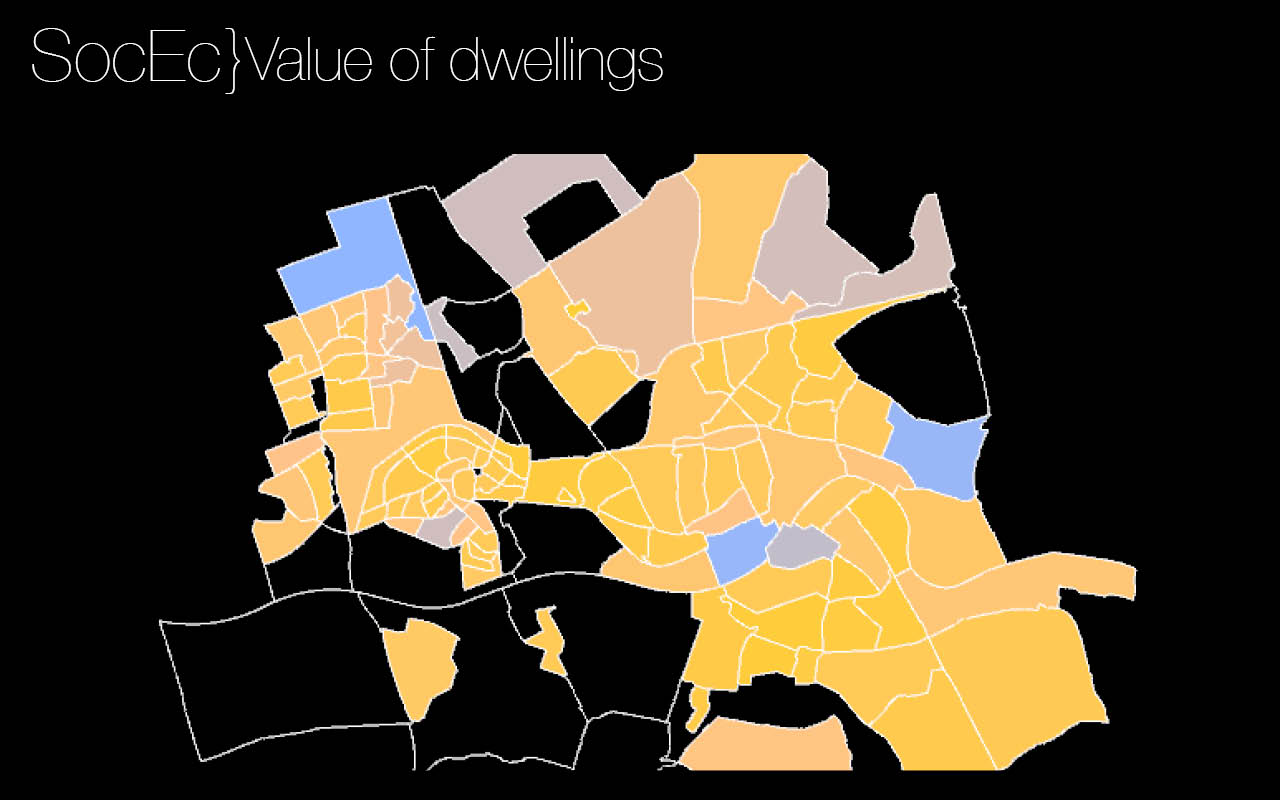
Value of the real estate. Profitability, Quantity? - > Real estate factors?
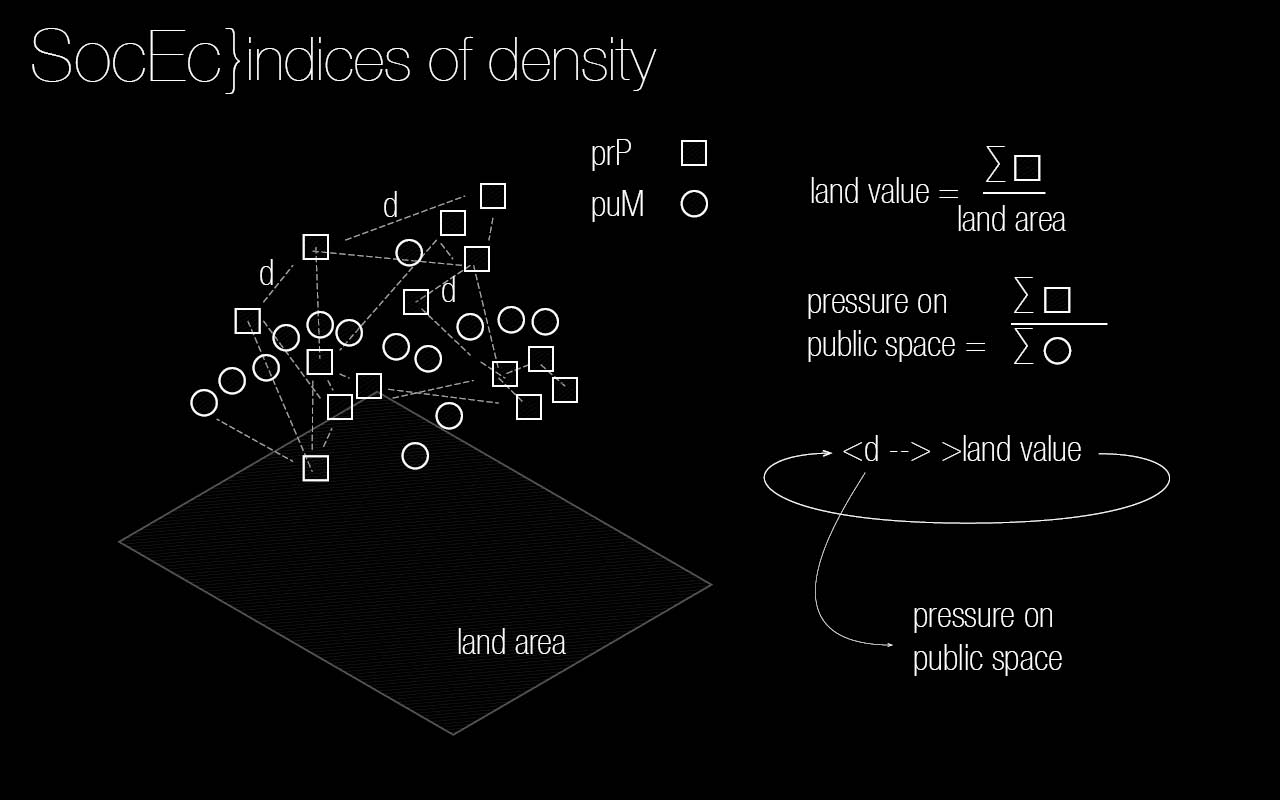
Value of the ground (and thus the public space)
Cost of building the facility
Cost of rent + cost of maintenance
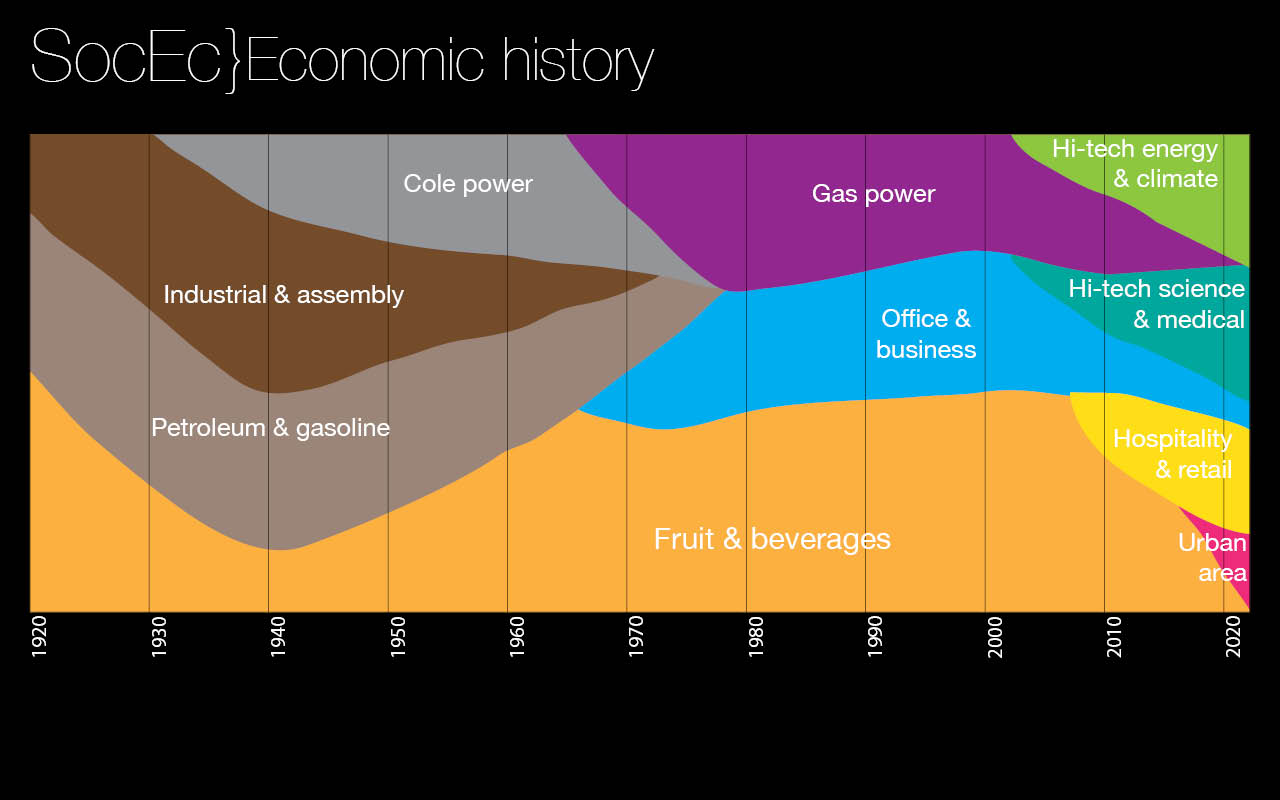
Economic activity over time (i.e harbour, changes, relation to other districts)
Current strategy for the area
3] Cultural background
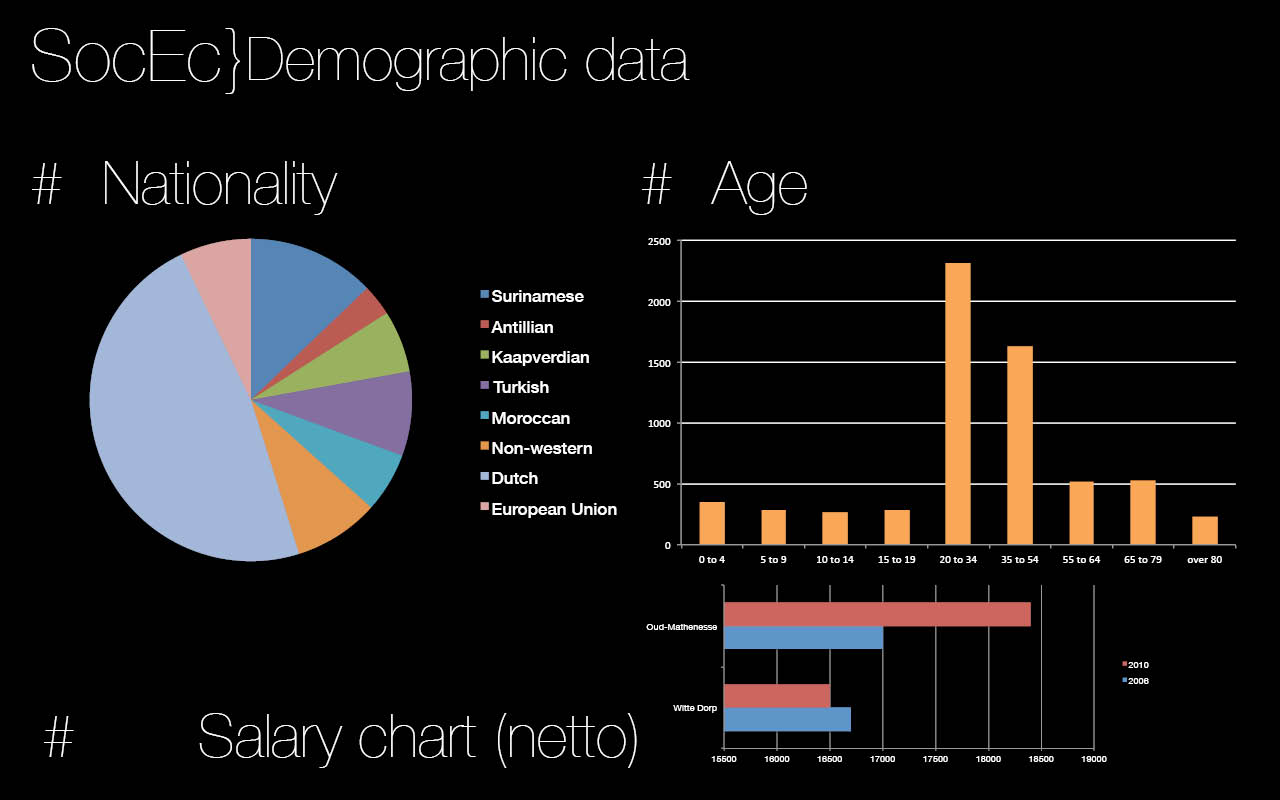
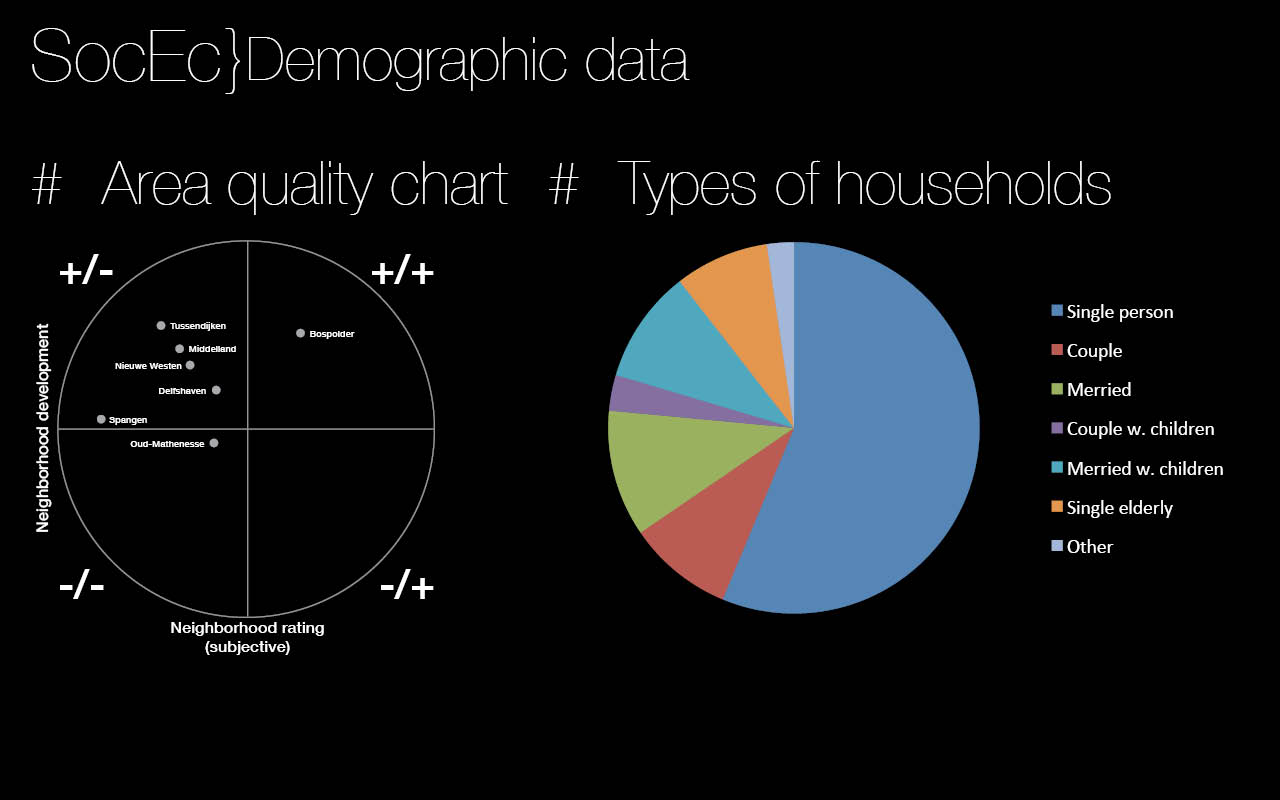
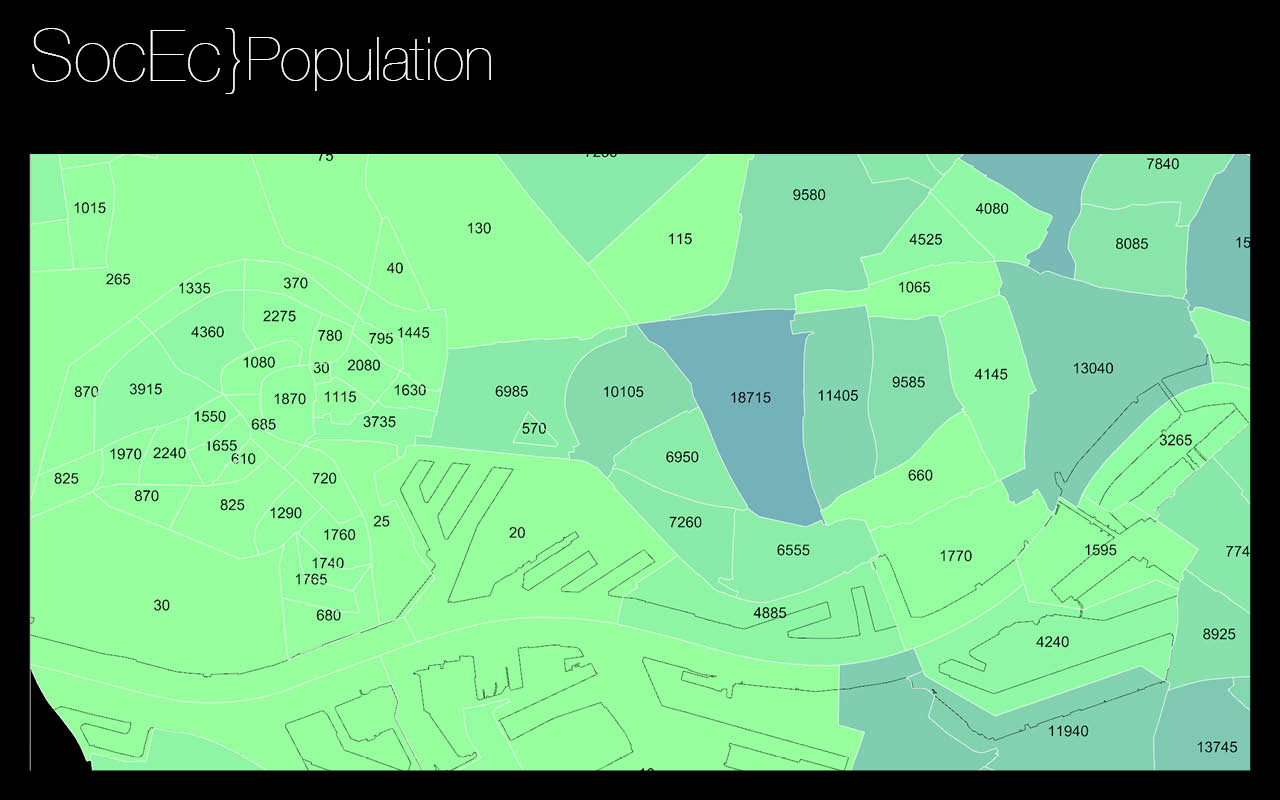
Quantity of people in the area
Earnings of people in the area
Nationality/Religion etc
4] Involving companies
List of the companies involved in the area
- Erasmus MC
- Erasmus University Rotterdam
- Fortress (developer)
- Hogeschool Rotterdam (university of applied sciences
- JOIN Ontwikkeling (developer)
- Laurens
- Medical Delta Multiplier
- Stadshavens Rotterdam (harbor company)
- ROC Zadkine (educational institute)
- Viroclinics Biosciences
- BIRD Recruitment
- Valorisatieprogramma Rotterdam
- Municipality of Rotterdam
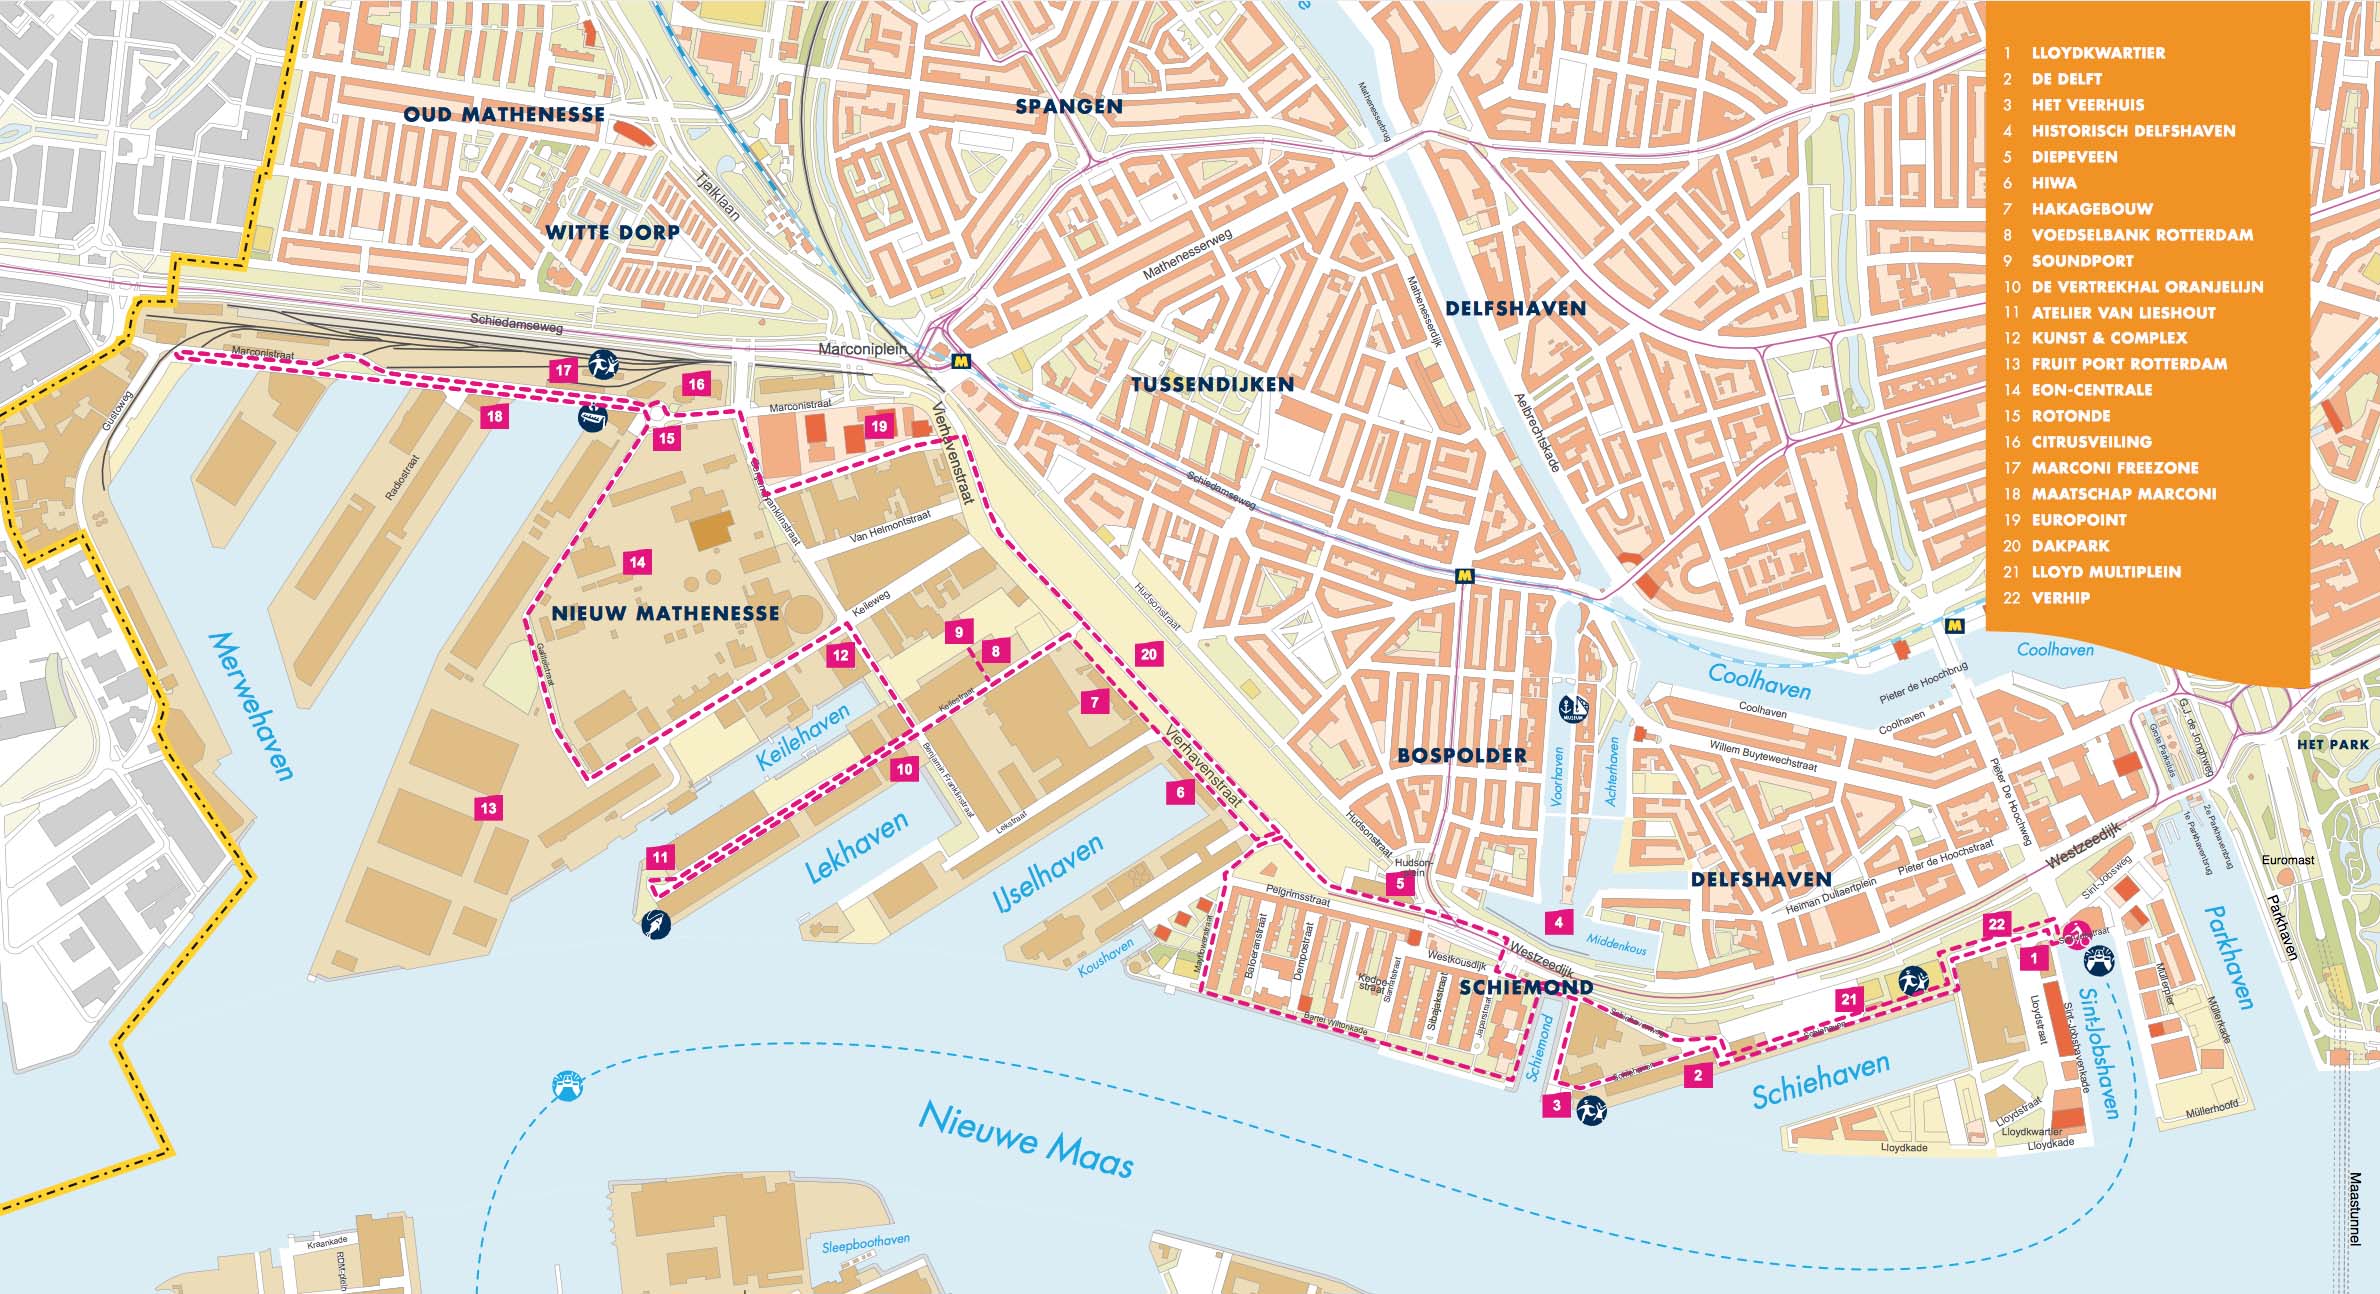
5] Historical background
- Marconi towers location was formerly a Ford factory
- Marconi house founded by NV Handelmaatschappij v/h Overbeek & Co.
- Marconi towers founded by Overbeek + English partner during financial crisis
Means of representation
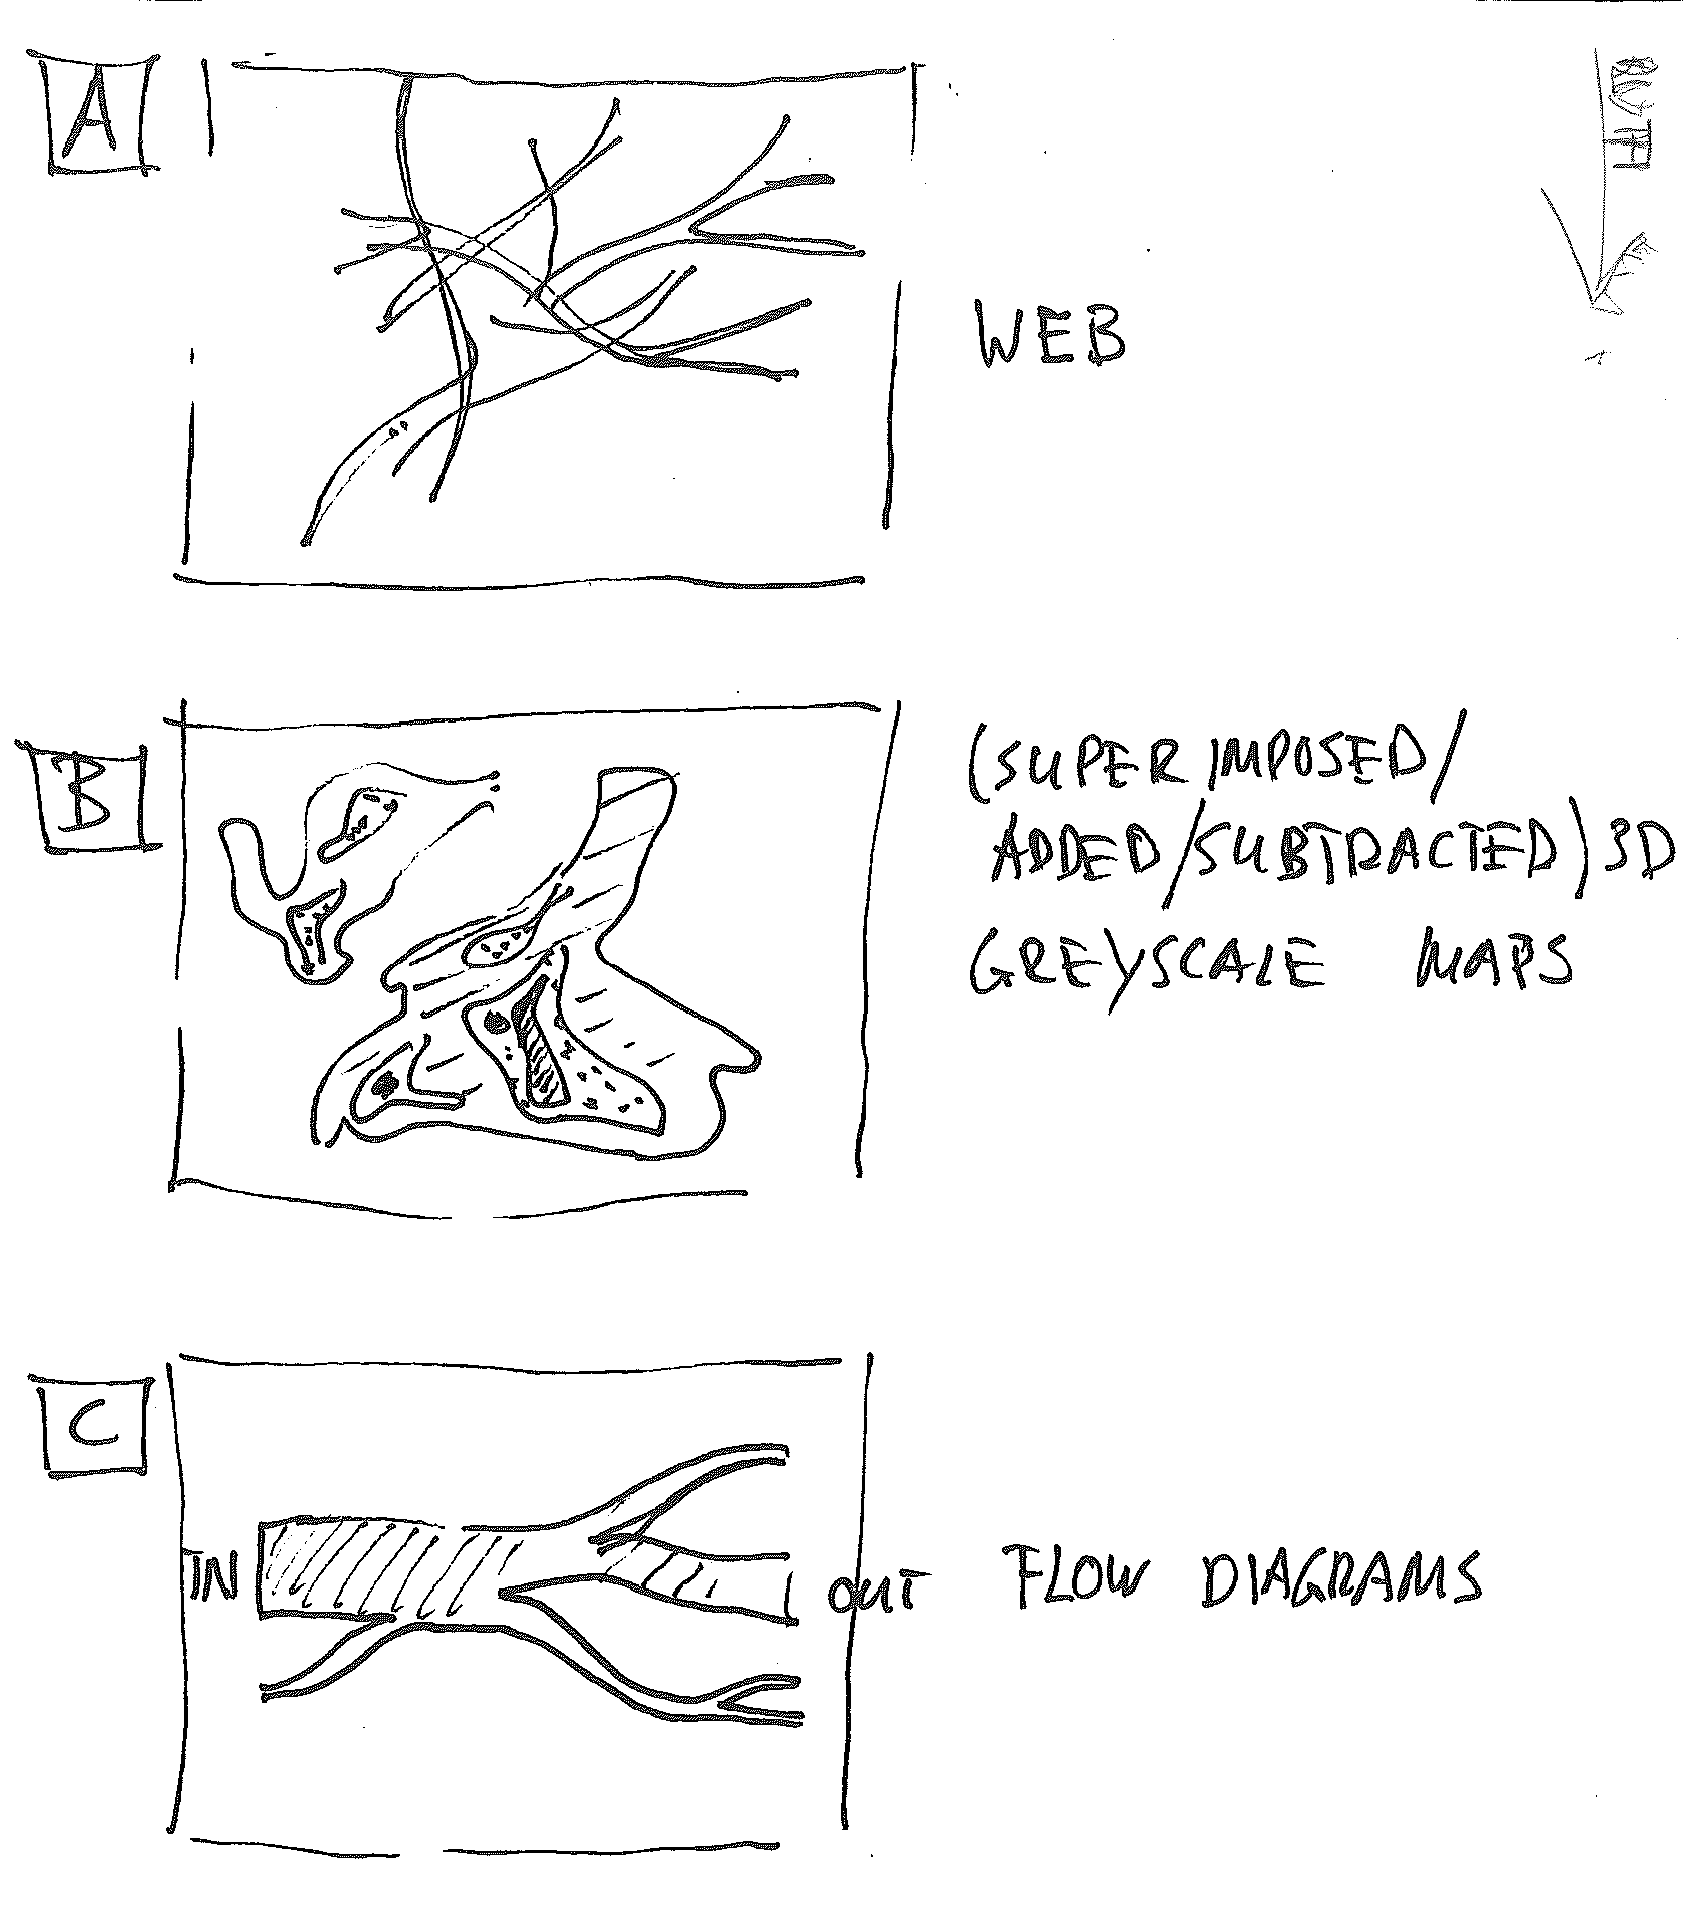
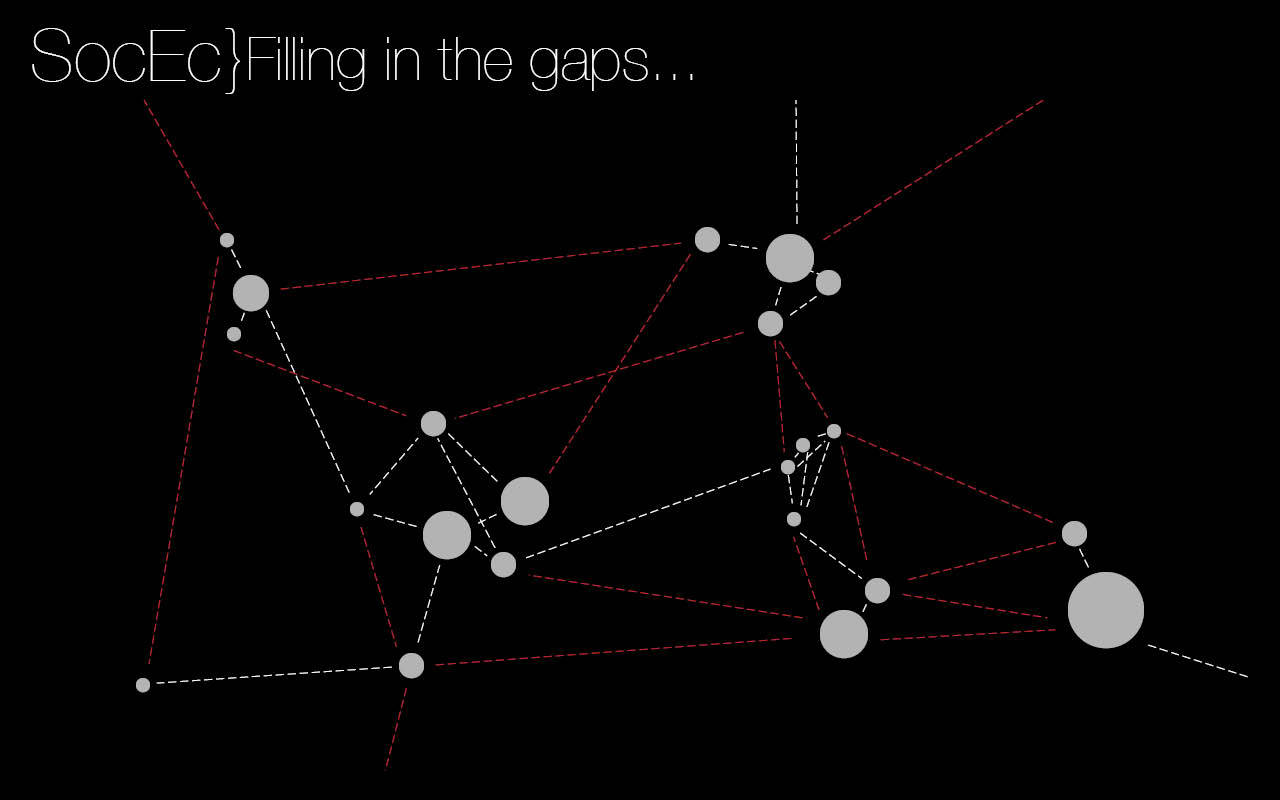
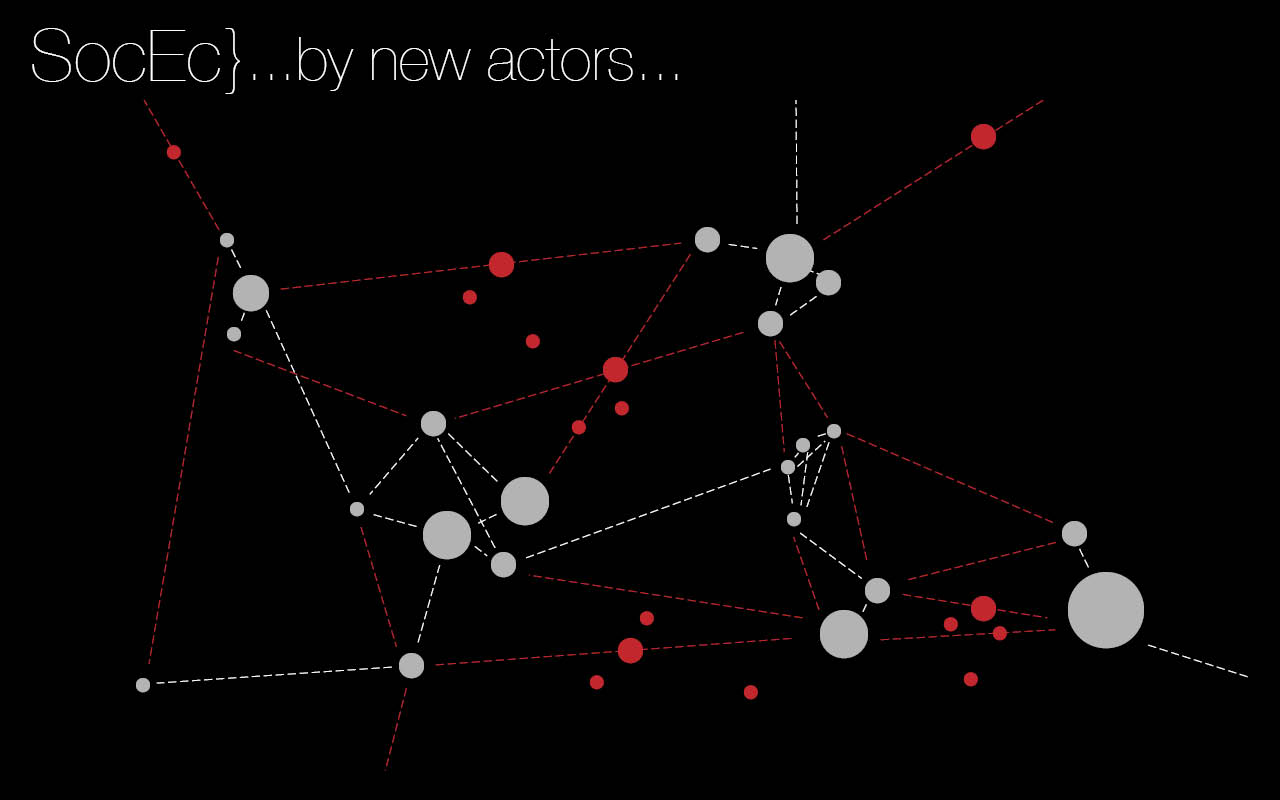
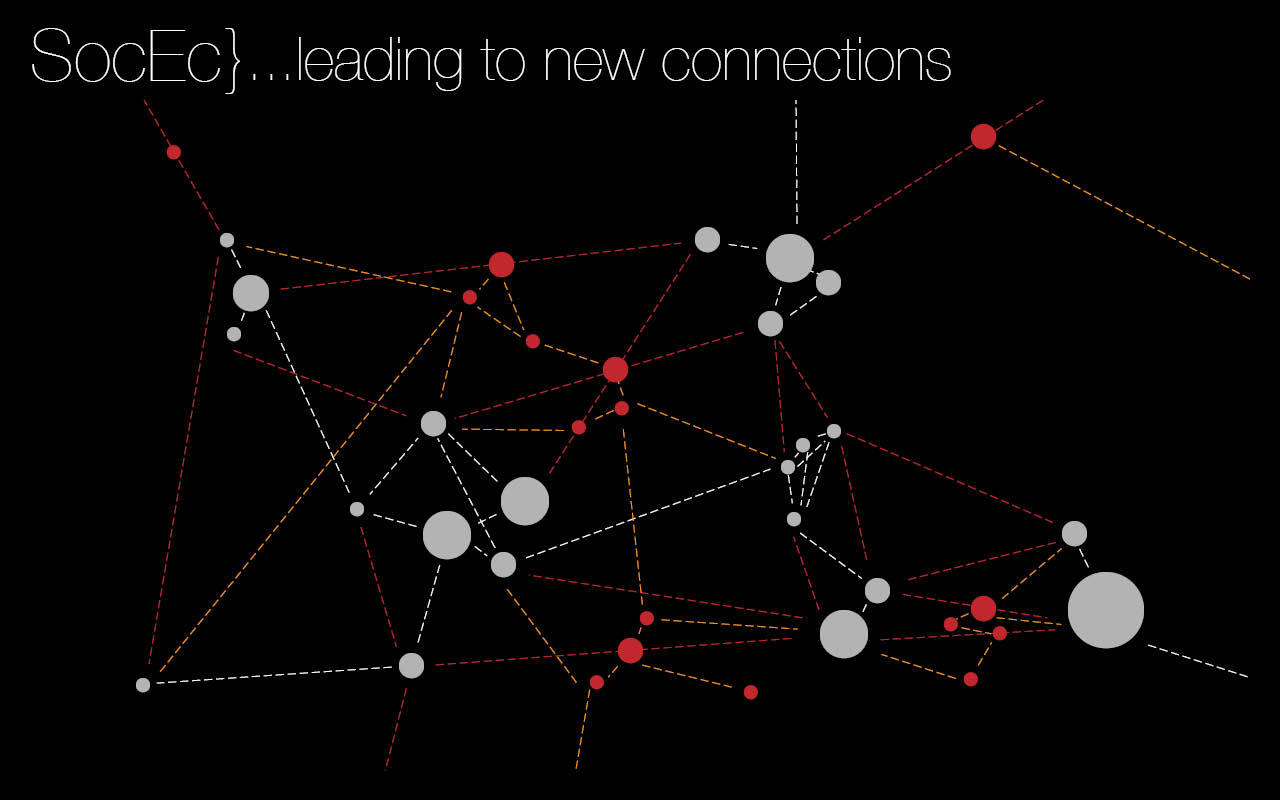
Three types of diagrams are proposed.
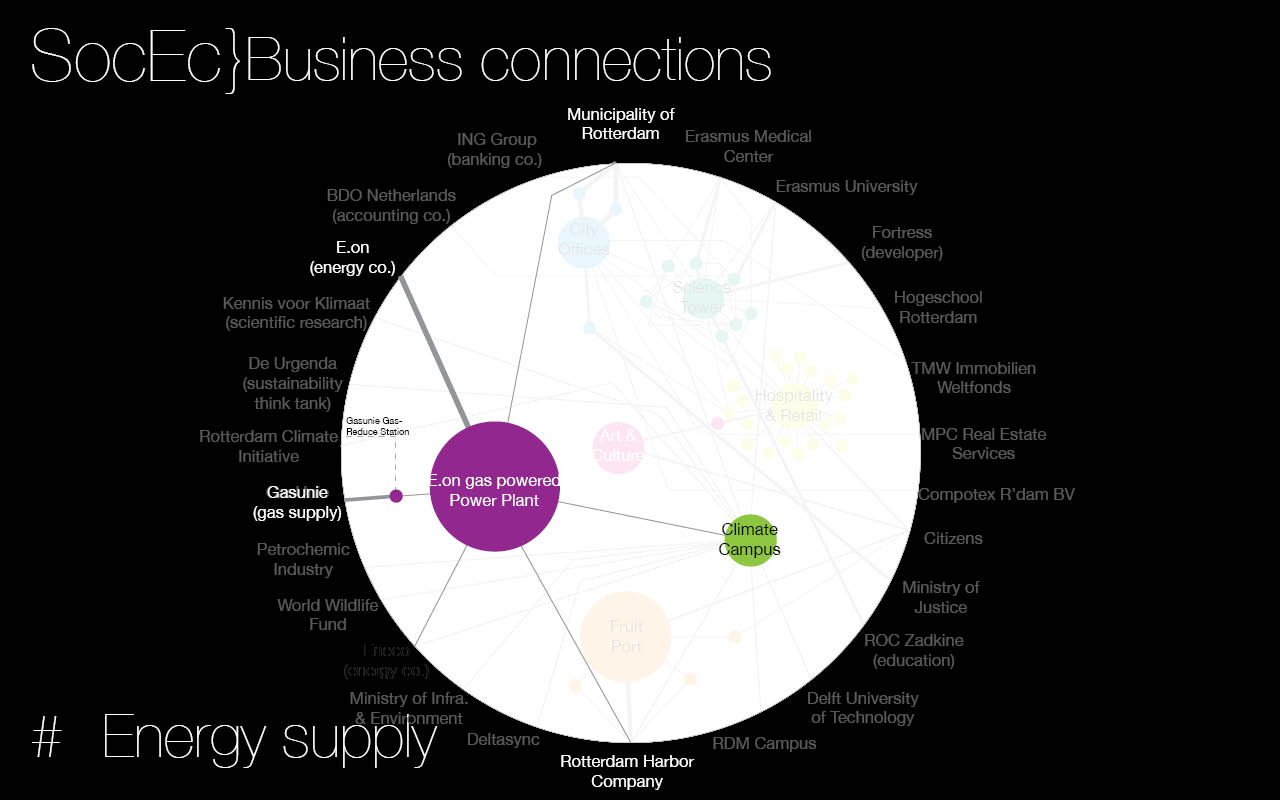
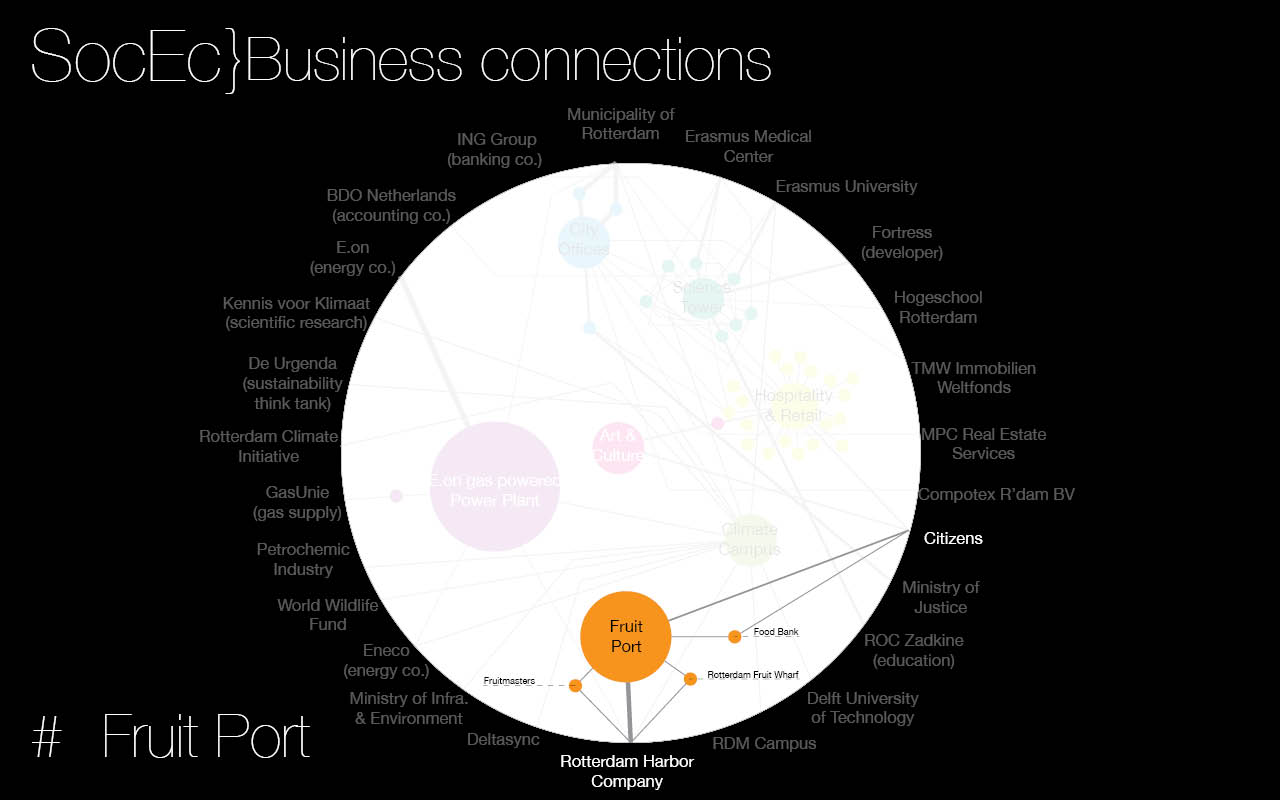
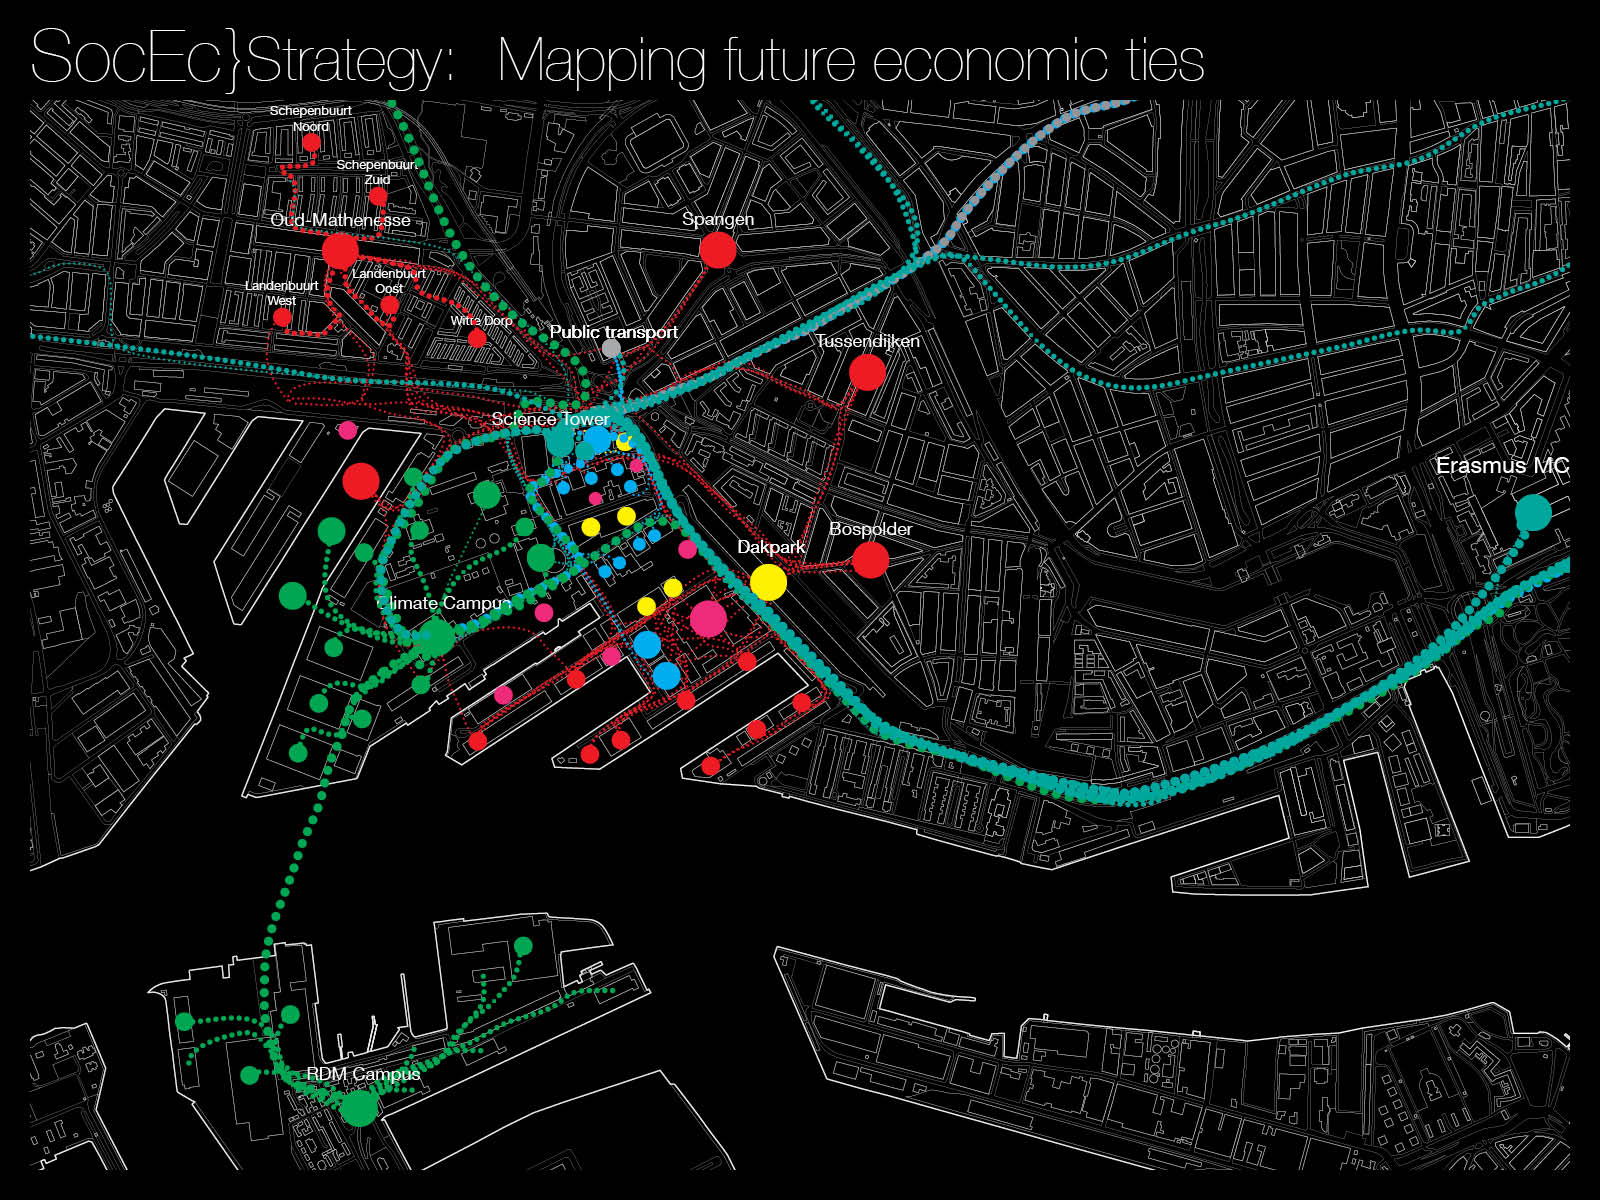
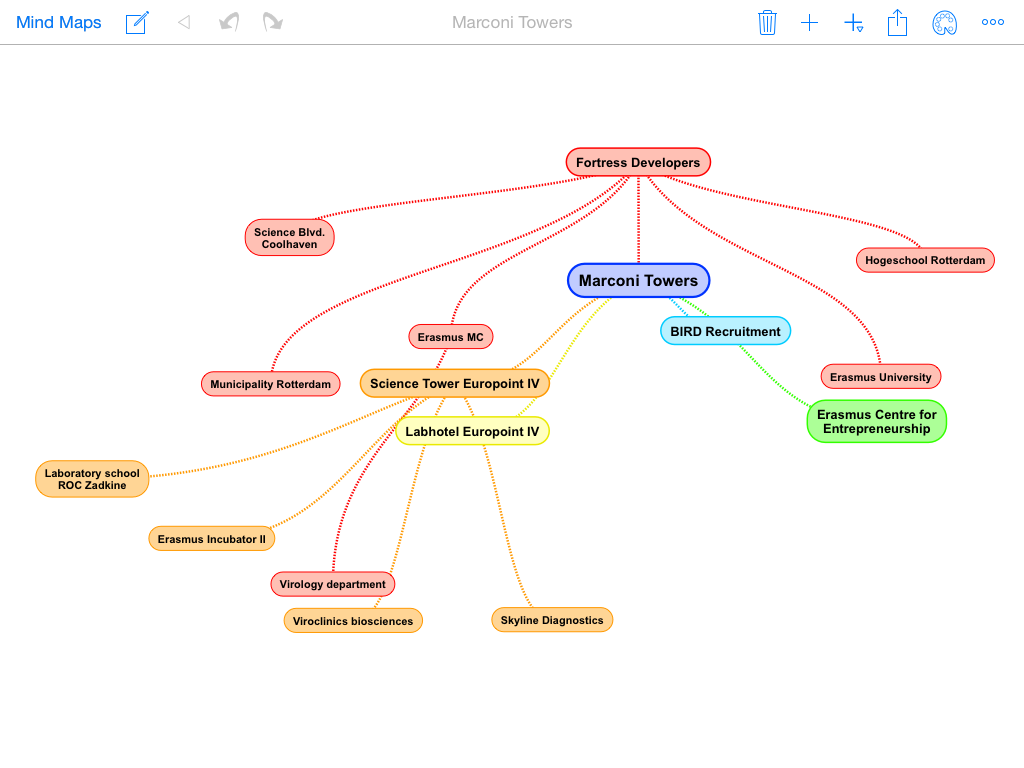
A Web
A web in which each relevant actor is displayed and each connection has a different line type. Line thicknesses vary as a function of the amount involved. Example: flow of money.
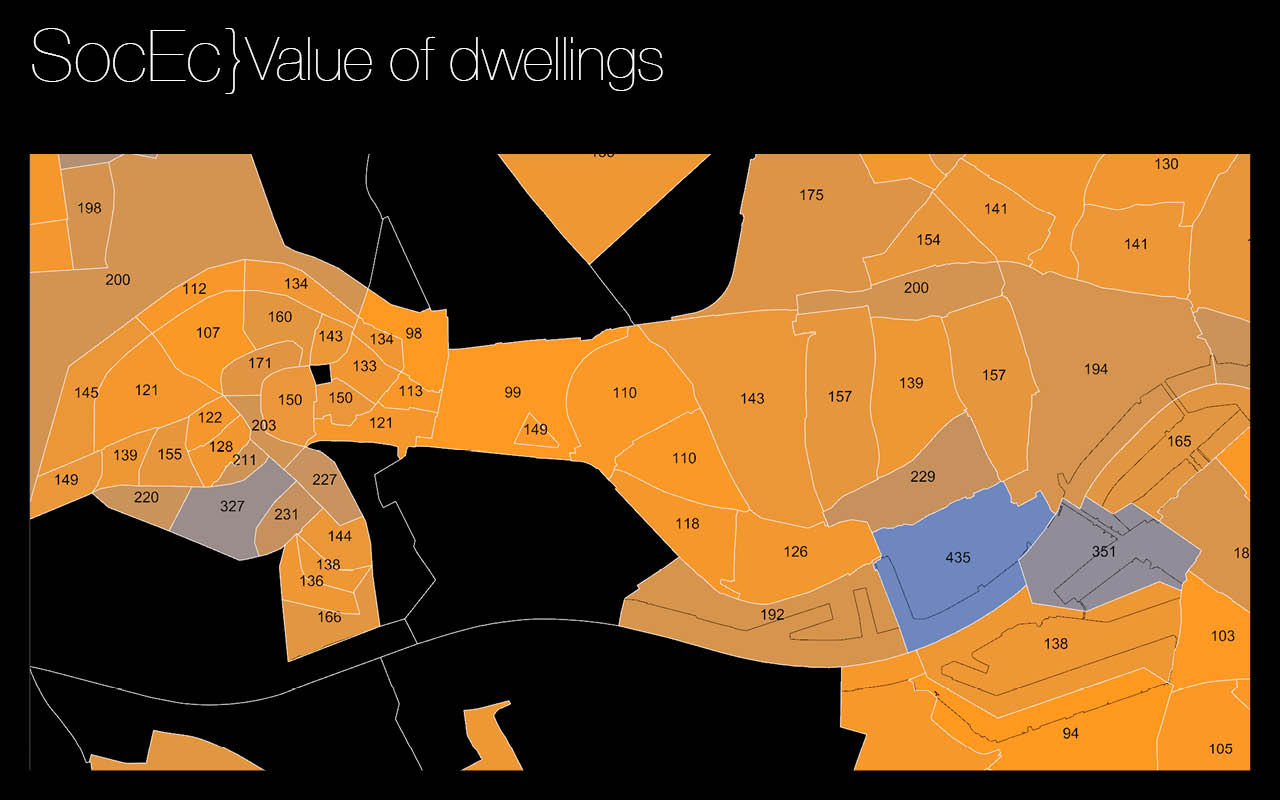
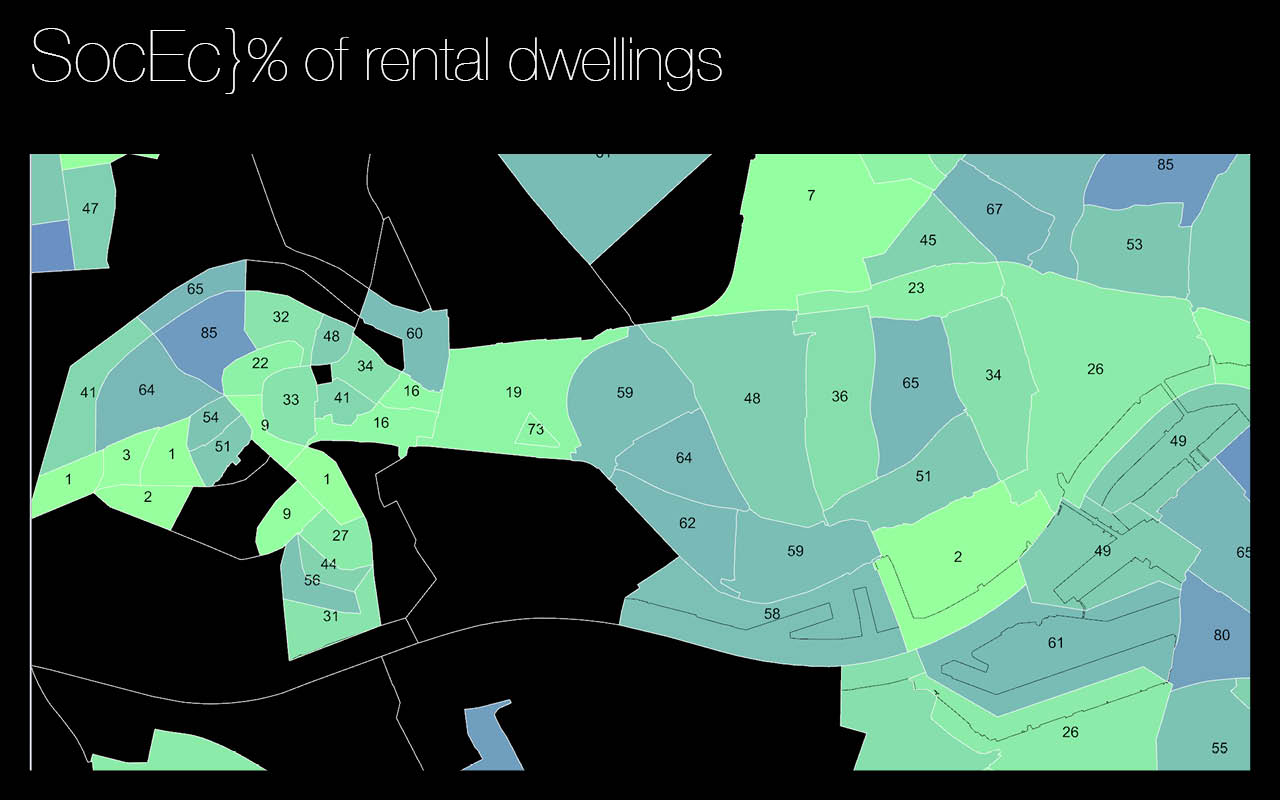
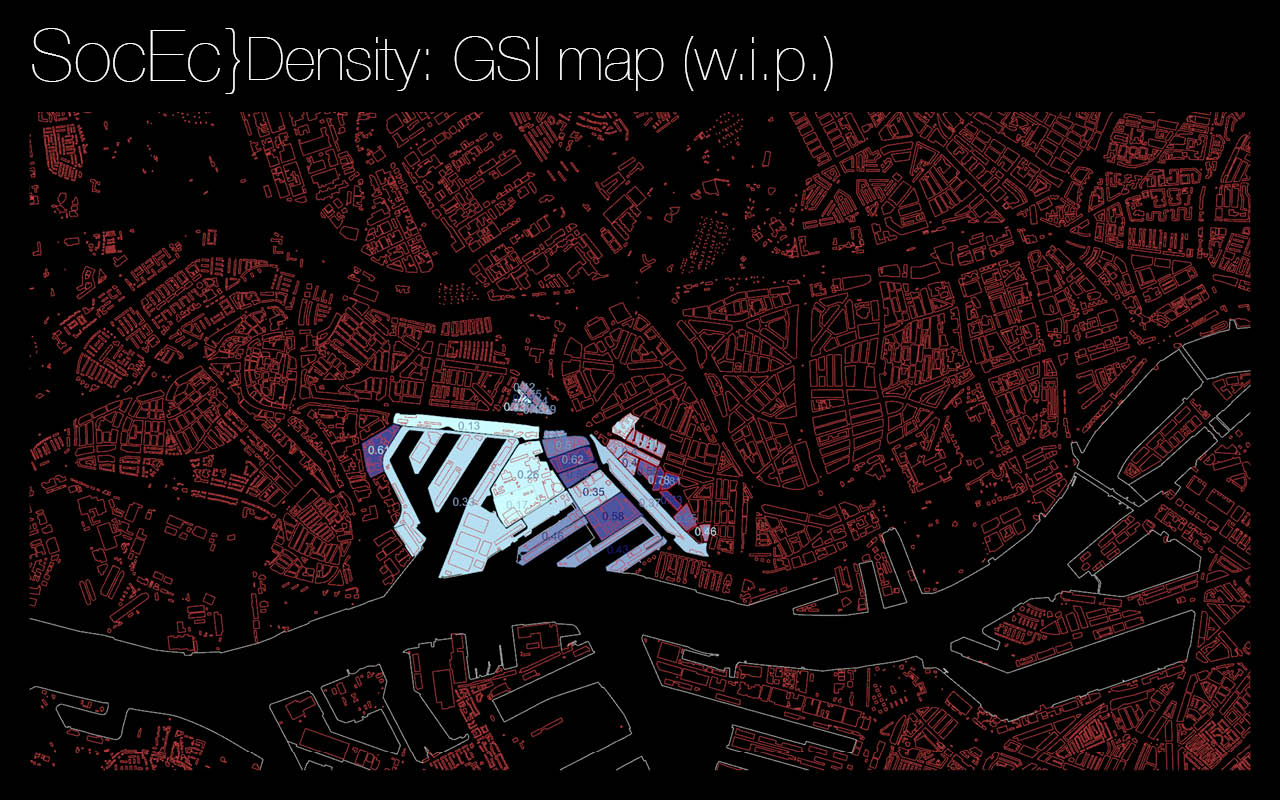
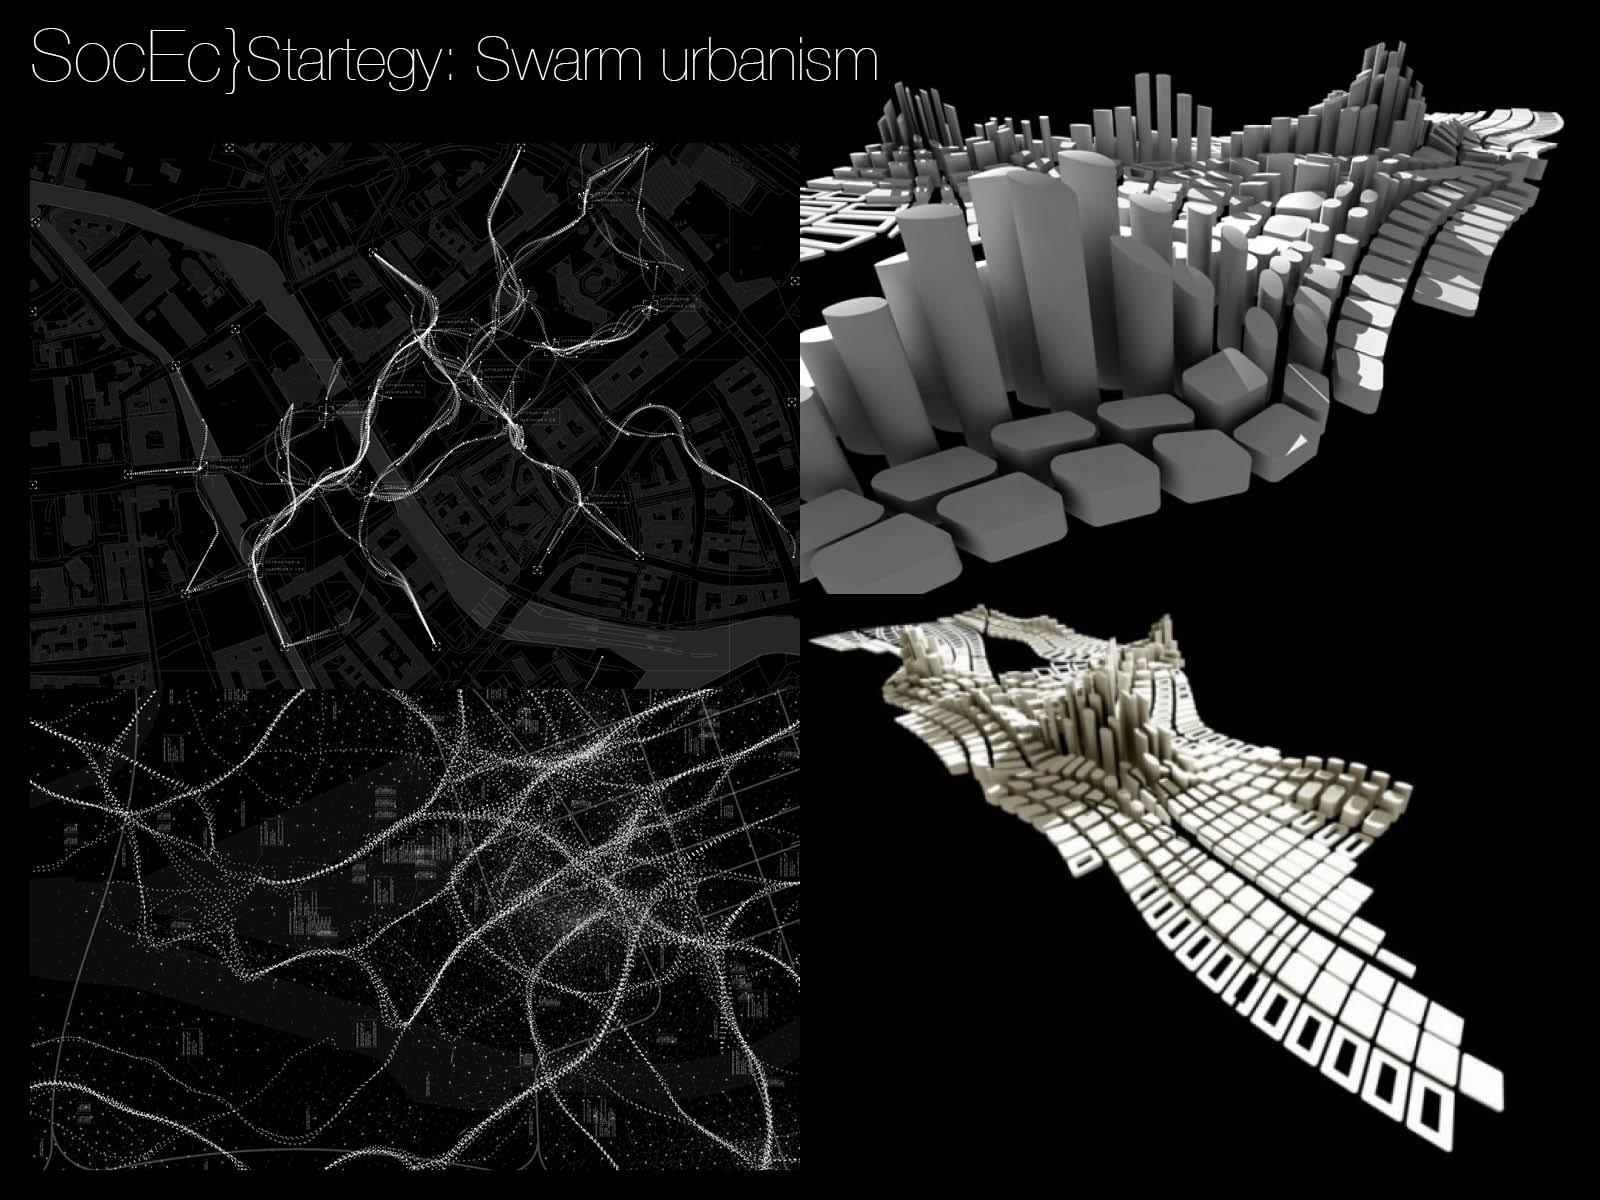
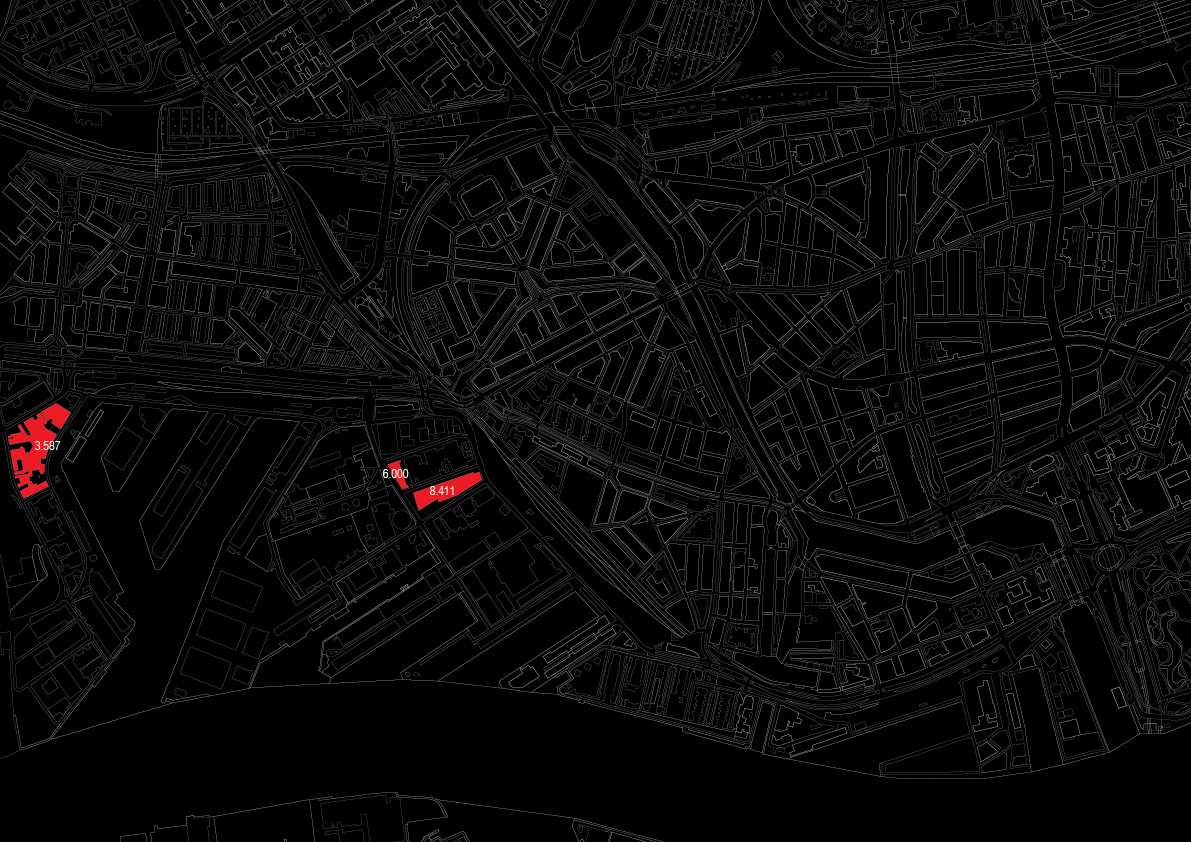
B Greyscale maps
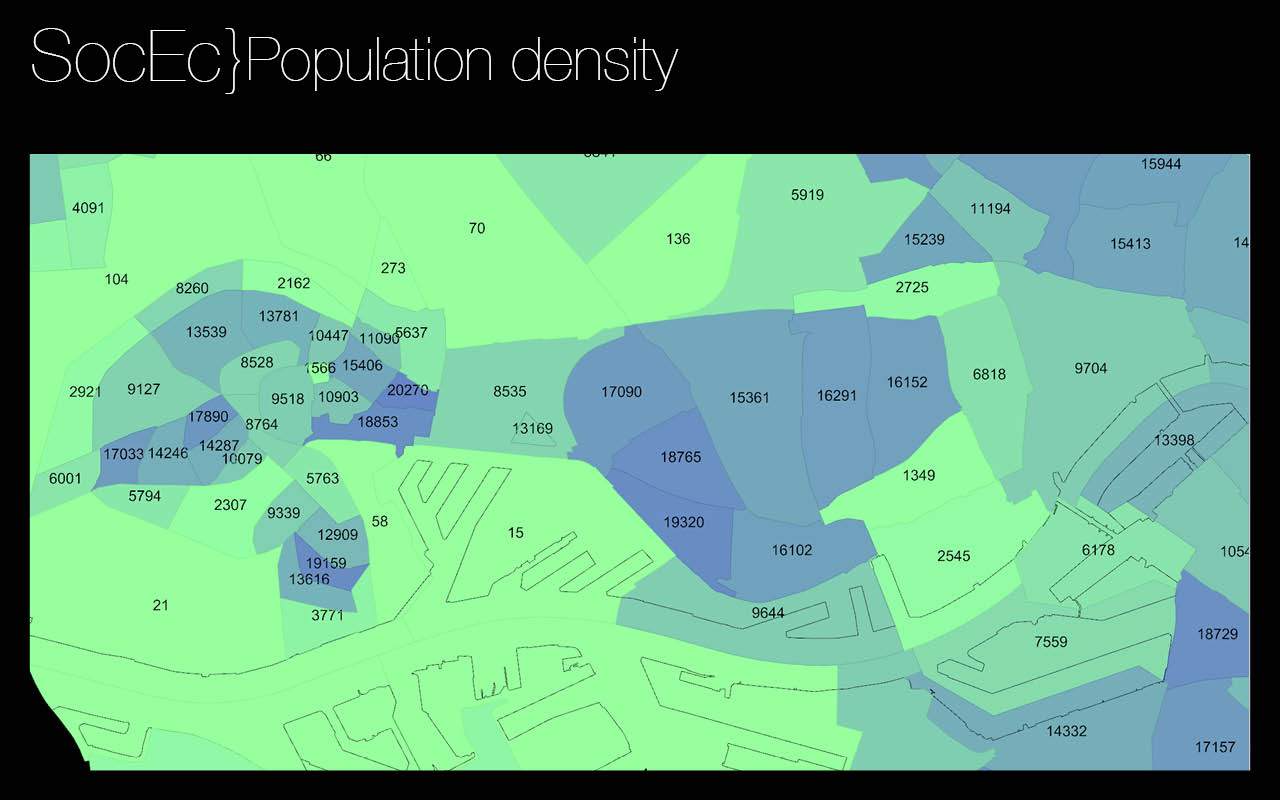
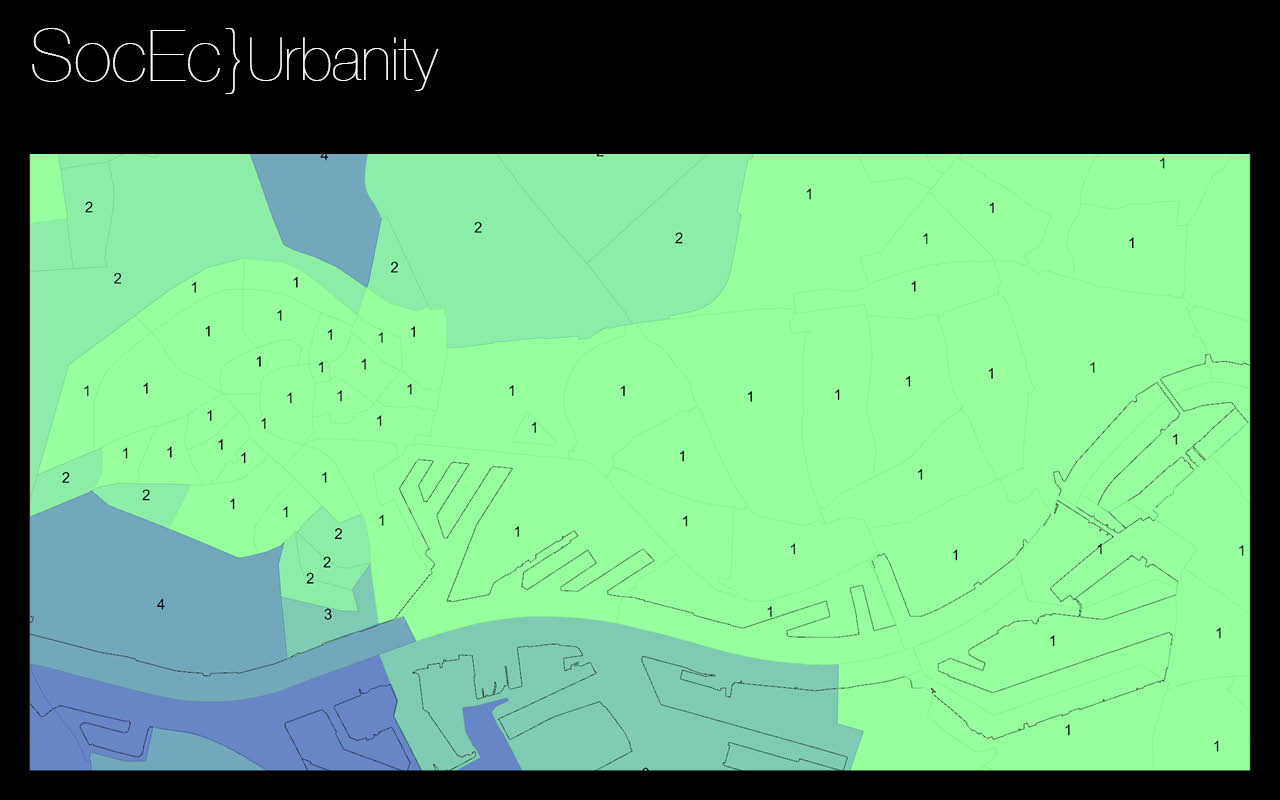
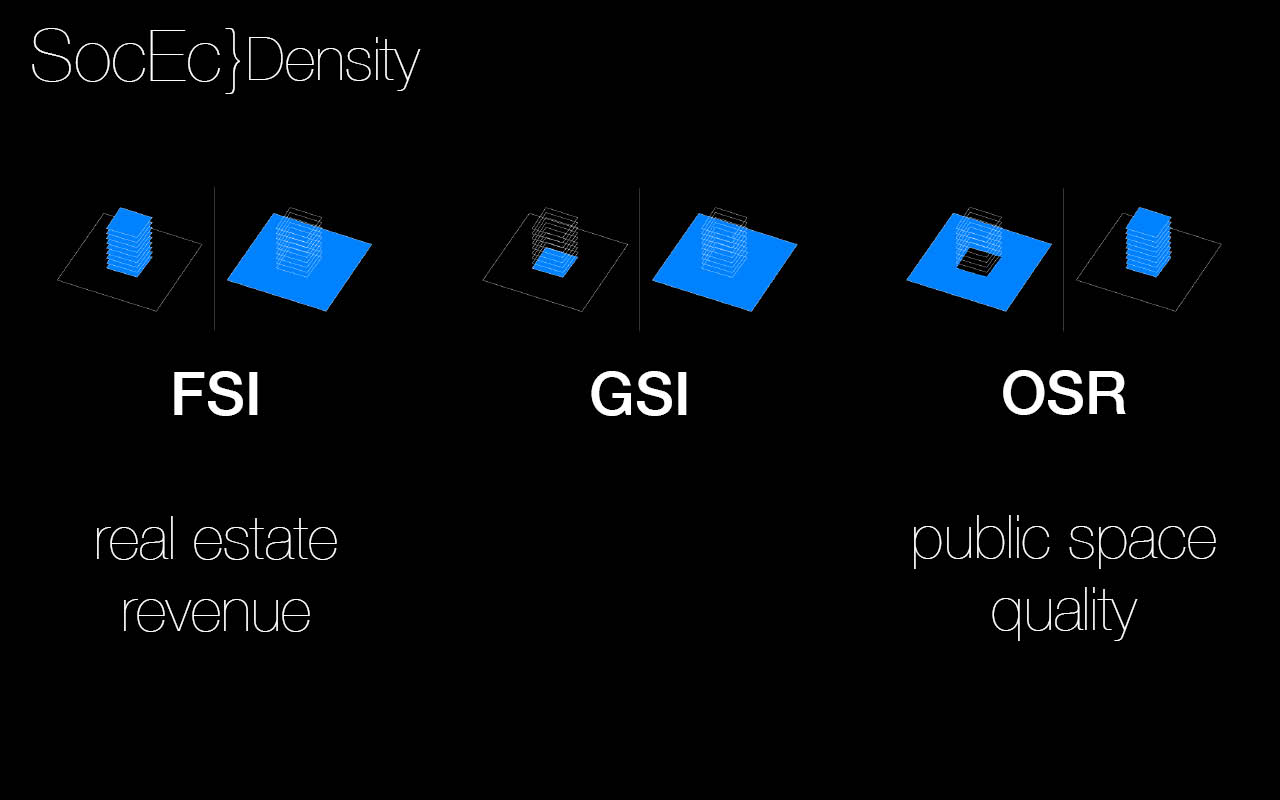
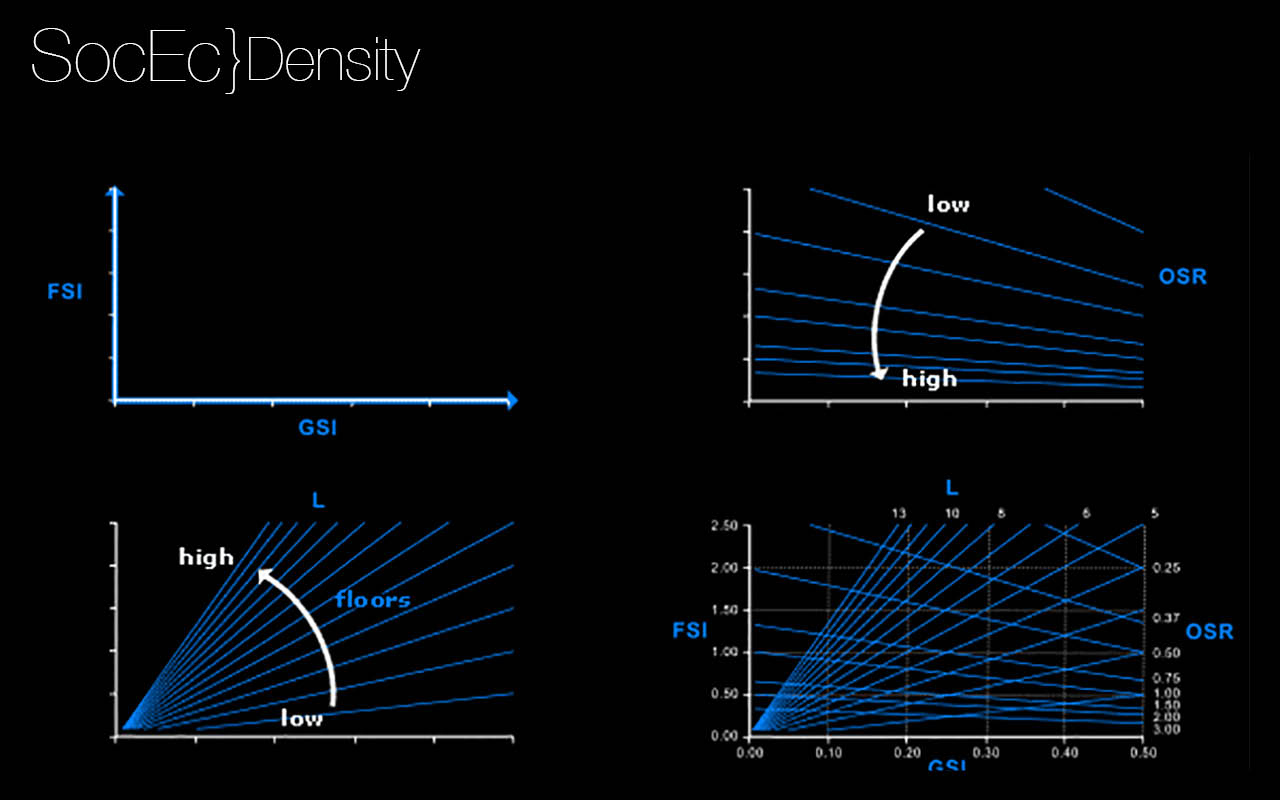
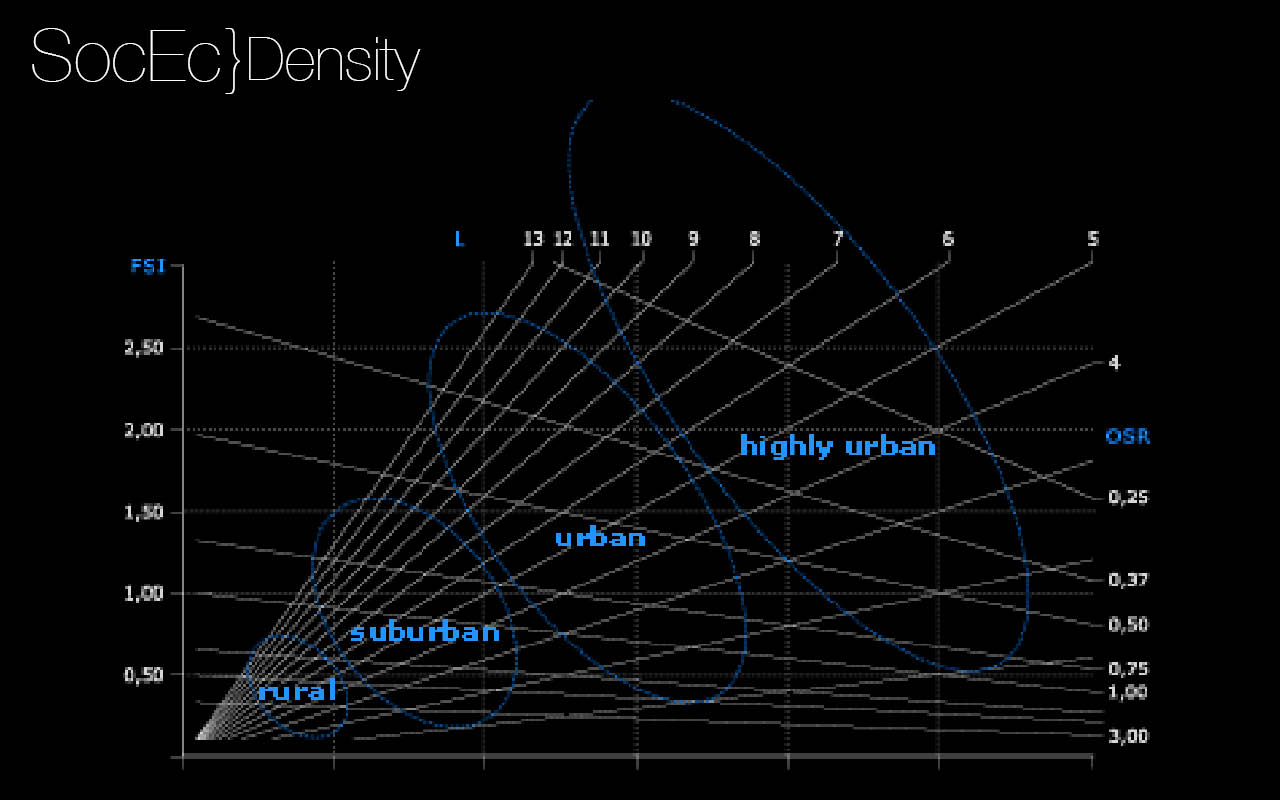
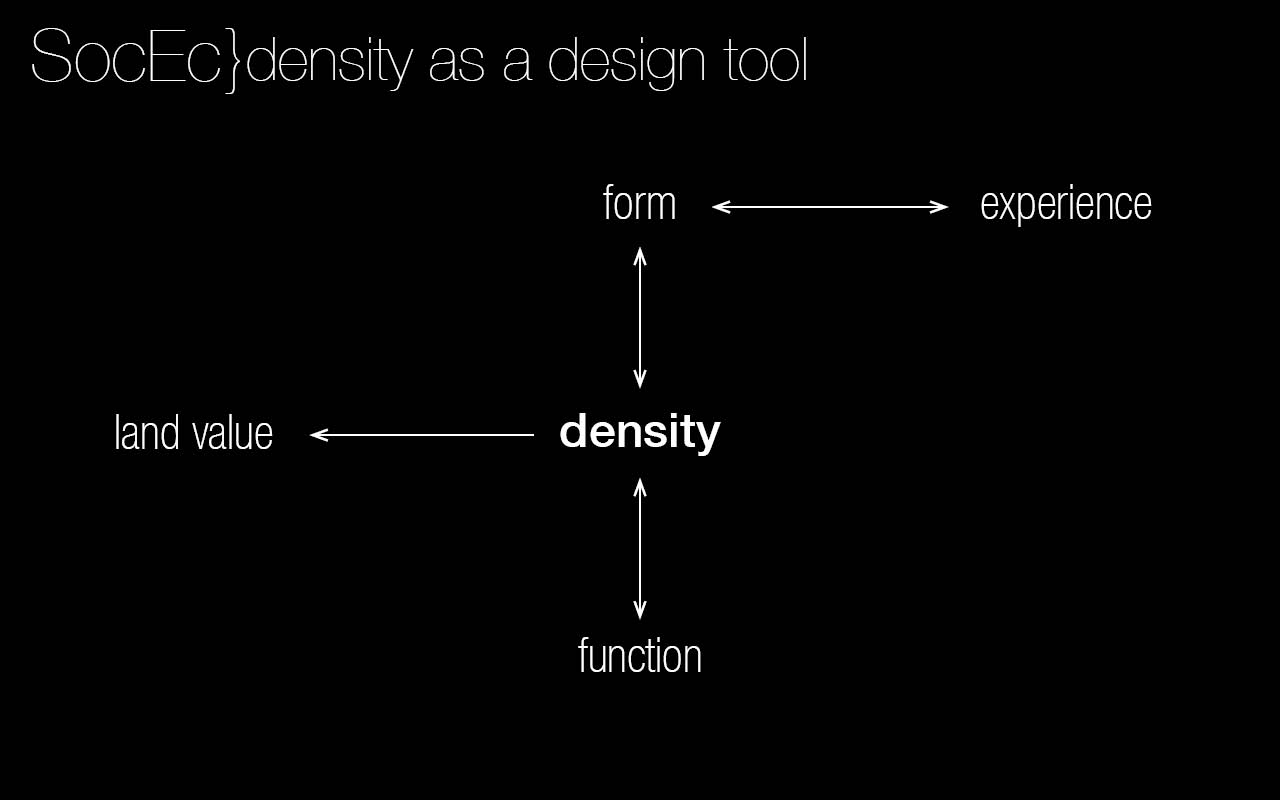
Displayed as a bump map. The values are mapped spatially over the city. Examples: ground value, density (FSI, OSR, GSI), income, etc.
These maps can be superimposed, made 3D (as if it were a bump map) and added/subtraced (or multiplied/divided) so that the relation between the factors can be made visible. For example ground value vs density.
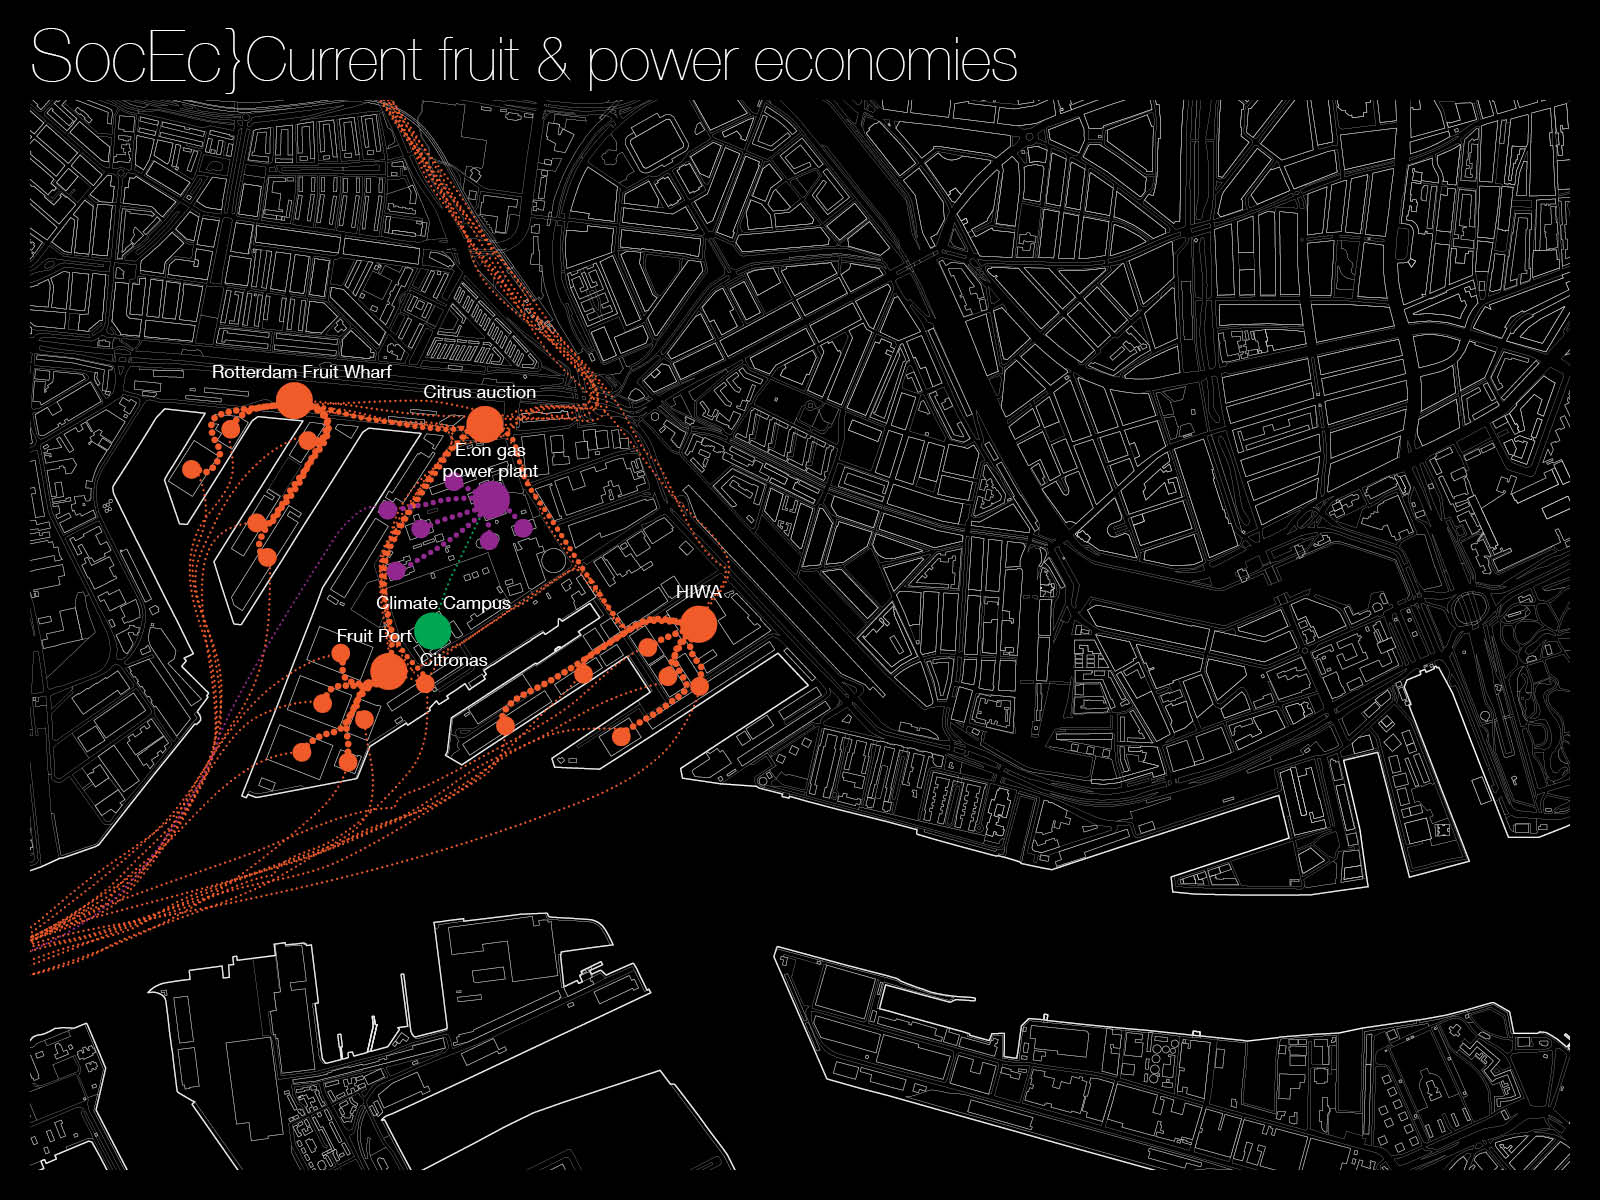
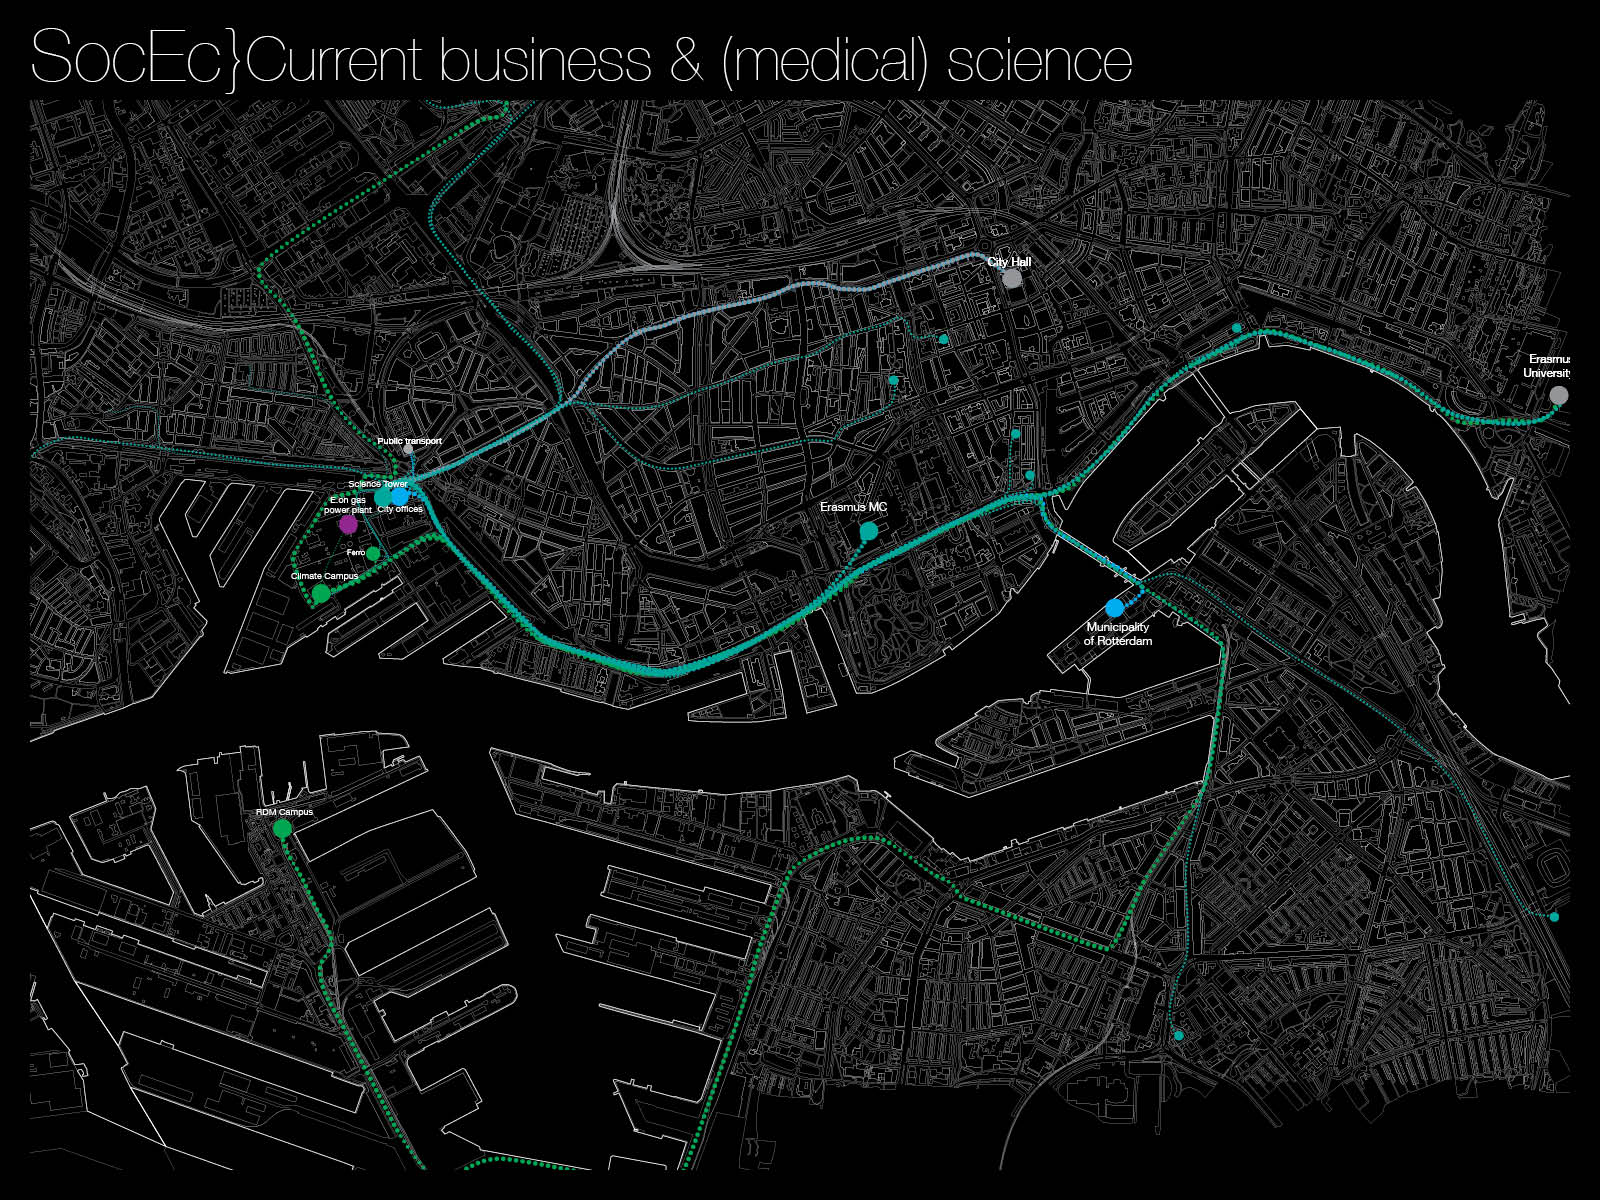
C Flow diagams
Like A. but not in a web because behaviour is more linear.
Factors / topics that influence socio-economic behaviour
(A quick brainstorm)
- income
- cultural background and ethnicity
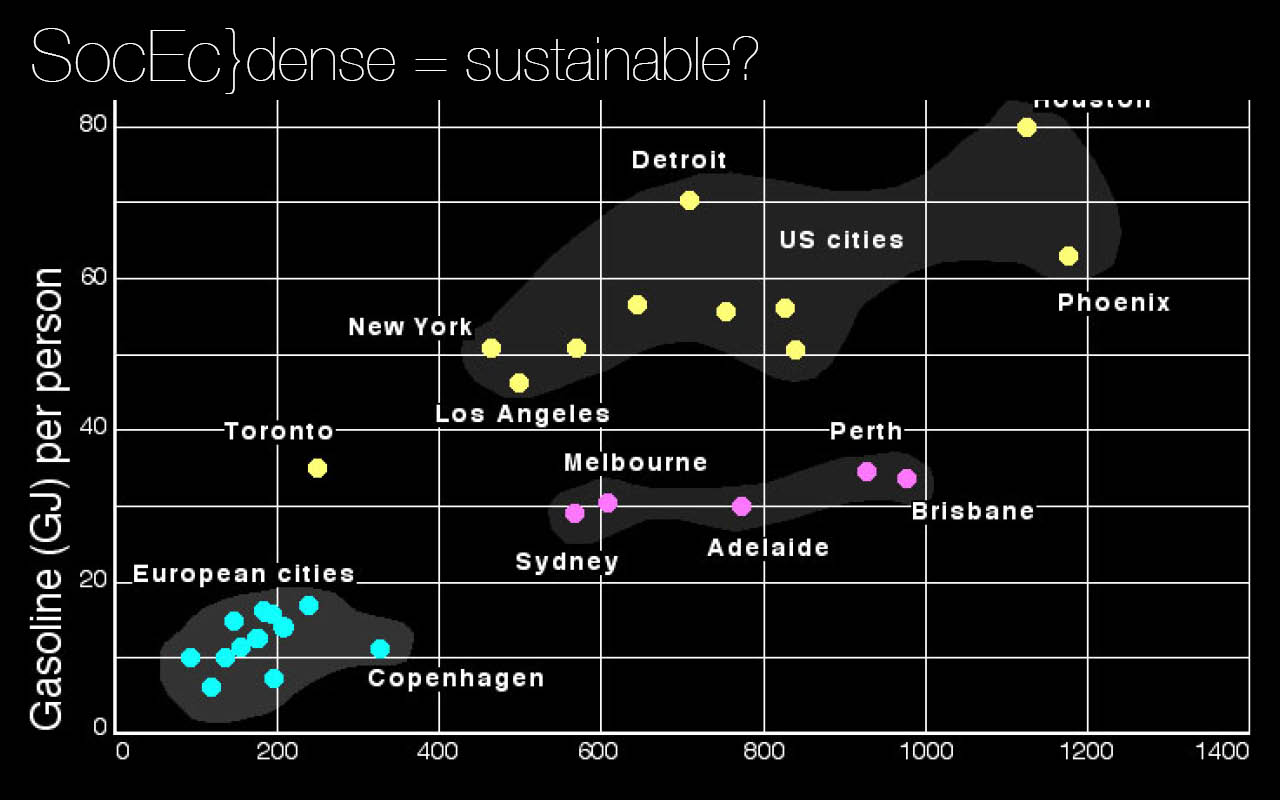
- density: buildings, people, usage of the public spacer
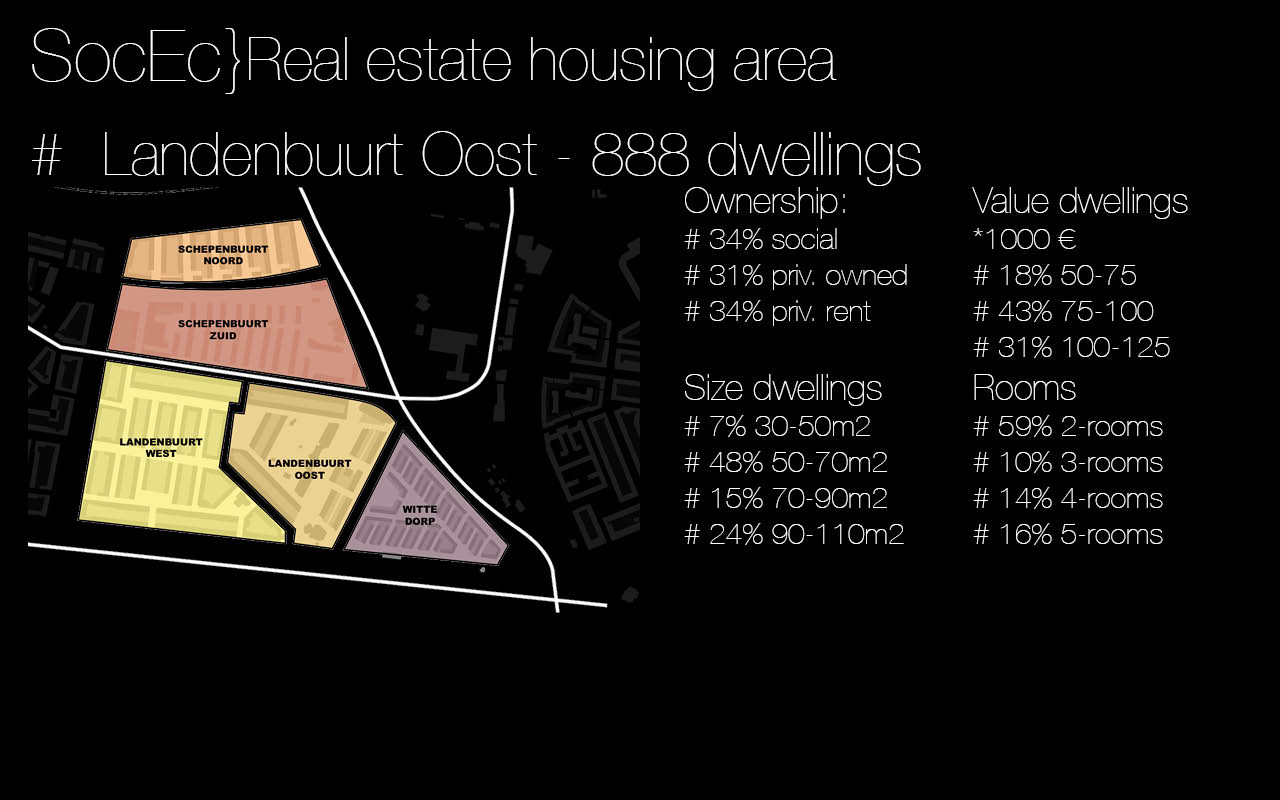
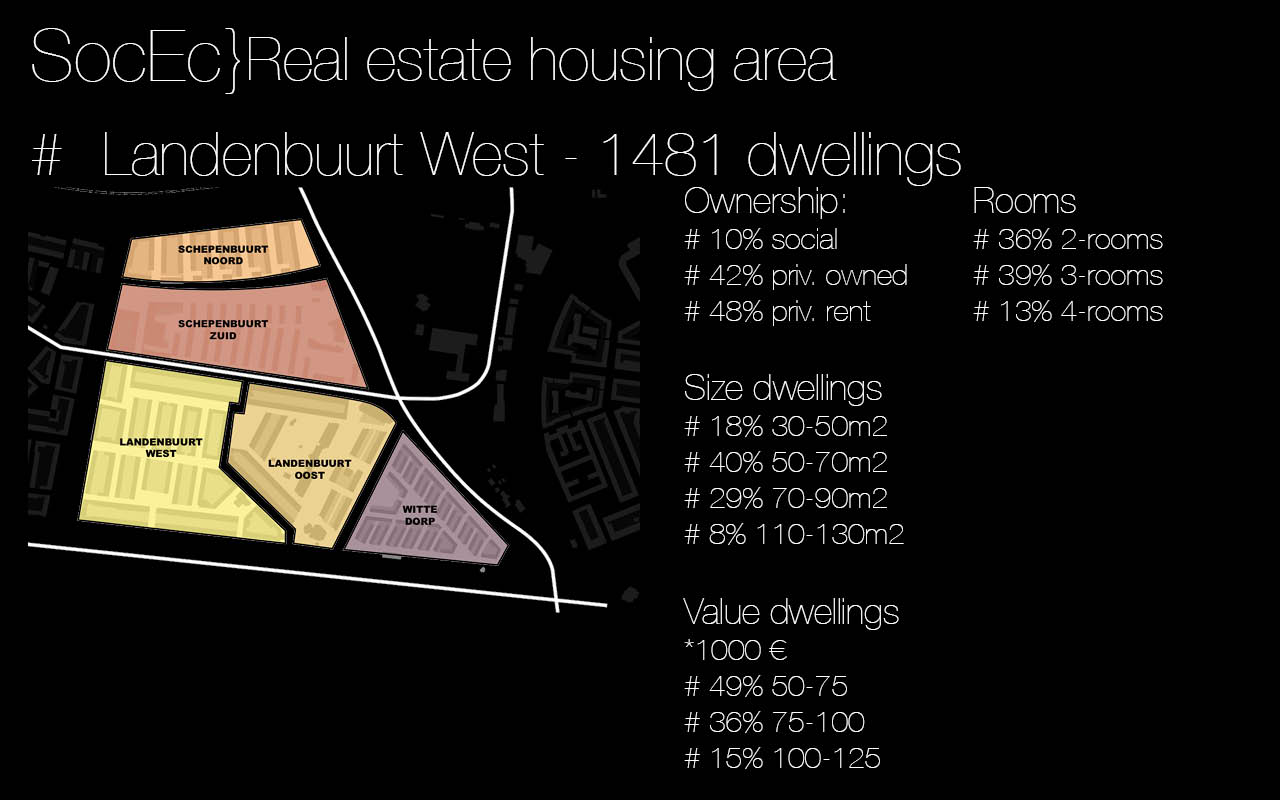
- housing: social/market, size, value, type (apartments, garden, etc.)
- hospitality & services (bars, restaurants, businesses)
- flow of money: where is the money earned, where does it go?
- flow of people (forensic)
- revenue of buildingsv
- models of revenue (for real estate)
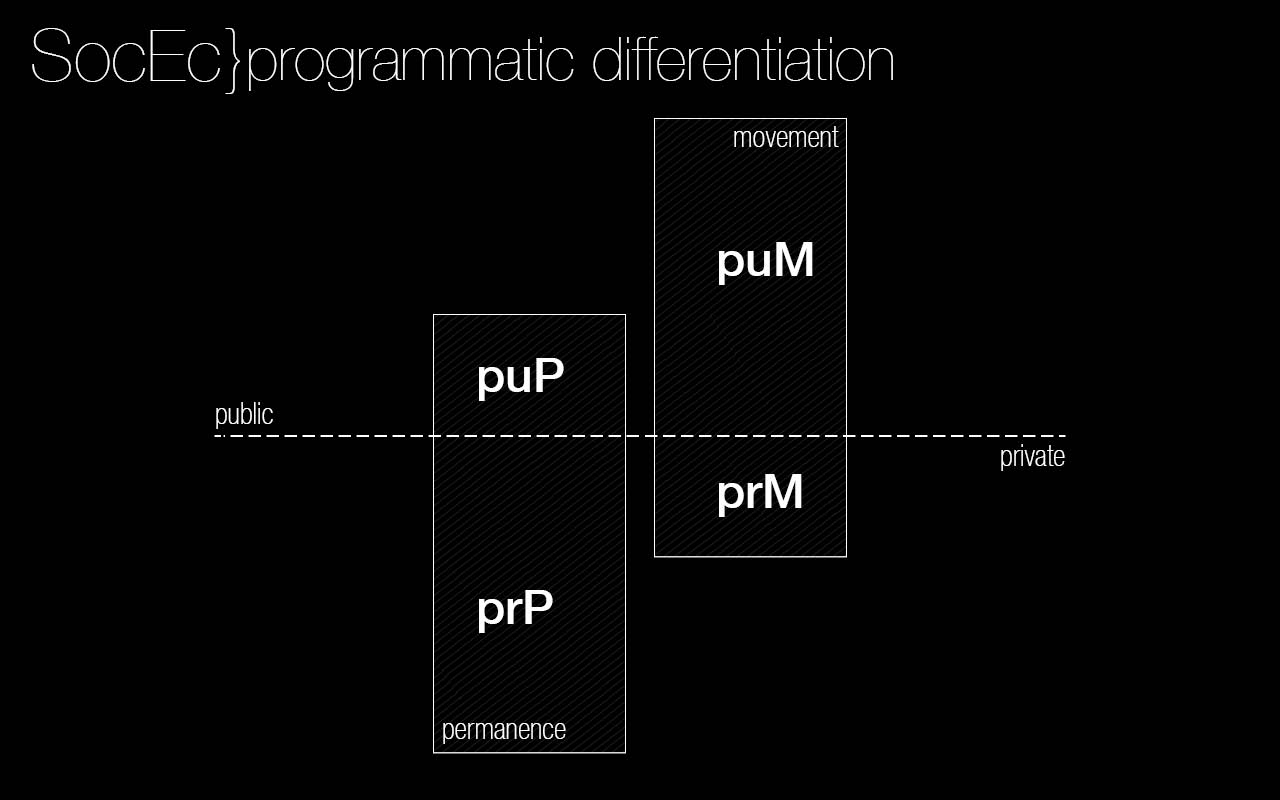
- the relations of above in PRIVATE < --- > PUBLIC
- general economic situation
- economics of the port